Among all General Conference delegates, only 36% are women. *
by Magaela Bethune, MS, MPA
Since the Special Called Session is a continuation of the 2016 General Conference, the great majority of the delegates at the Special Called Session are the same individuals who attended the 2016 General Conference. A few Annual Conferences held elections for new delegates, and some 2016 delegates have been replaced by reserves because they are no longer able or eligible to serve.
In 2016, the General Commission on the Status and Role of Women (GCSRW) published a 2016 four-part report on the representation of women among 2016 delegates. In anticipation of the upcoming special session, GCSRW presents this updated breakdown of the 2019 delegates, with special focus on the representation of women.
*Gender data for 12 delegates (10 – Concordat, 1 – Texas, 1 – West Congo) were not reported, and therefore are not reflected in this figure.
Gender Distribution of 2019 Conference Delegates

Of the 2019 General Conference delegates (N=862) that will attend the 2019 Special Session in February 2019. Of the delegates for who gender information are available (n=850), 36% are women and 64% men.
The basic unit of The United Methodist Church is the Annual Conference. In the United States, the Annual Conferences are organized into five jurisdictions: North Central, Northeastern, South Central, Southeastern, and Western. Annual Conferences outside of the United States are organized into seven Central Conferences by regions in Africa: Africa, West Africa, Congo; Europe: Central/Southern Europe, Germany, North Europe/Eurasia; and the Philippines. Also included in the Central Conference delegations are those delegates from the autonomous or affiliated churches.
Across the entire church, women’s representation among delegations varies, ranging from a low of 19.7% in the Congo Central Conference to a high of 54.7% in the Northeastern Jurisdiction. Indeed, the underrepresentation of women delegates is more pronounced in the Central Conference regions than in U.S. jurisdictions. Of the 544 male General Conference delegates, 44% (n = 260) are from Central Conferences. Of the 306 female General Conference delegates, 28% (n = 87) are from Central Conferences.
| Gender Distribution of Clergy and Lay Delegates by Jurisdiction/Central Conference | ||||
|---|---|---|---|---|
| Jurisdiction/Central Conference | Male | Female | ||
| % | n | % | n | |
| North Central | 52.2% | 48 | 47.8% | 44 |
| Northeastern | 45.3% | 39 | 54.7% | 47 |
| South Central 2 | 63.9% | 69 | 35.2% | 38 |
| Southeastern | 58.8% | 110 | 41.2% | 77 |
| Western | 58.1% | 18 | 41.9% | 13 |
| U.S. JURISDICTIONS | 56.3% | 284 | 43.5% | 219 |
| Africa | 59.5% | 25 | 40.5% | 17 |
| West Africa | 78.8% | 63 | 21.3% | 27 |
| Congo | 79.6% | 109 | 19.7% | 27 |
| AFRICA REGION | 76.1% | 197 | 23.6% | 61 |
| Central/Southern Europe | 71.4% | 10 | 28.6% | 4 |
| Germany | 66.7% | 4 | 33.3% | 2 |
| North Europe/Eurasia | 73.7% | 14 | 26.3% | 5 |
| EUROPE REGION | 71.8% | 28 | 28.2% | 11 |
| PHILIPPINES | 70.0% | 35 | 30.0% | 15 |
| CONTRAL CONFERENCES | 74.7% | 260 | 25.0% | 87 |
[1]Two people did not report their gender.
[2]One person did not report their gender.
Clergy and Lay Delegates
Half of the General Conference delegates are laity and half are clergy with the number of delegates representing each jurisdiction and each annual conference being proportional to the jurisdiction and annual conference’s membership.
Tables 2 and 3 show the gender distribution of clergy and lay delegates for each jurisdiction/central conference.
In most jurisdictions and central conferences, women are underrepresented among clergy delegates, and are more likely to be delegates elected among laity. Overall, only 29% of delegates that are clergy are women; 71% are men. This ratio is similar to the gender distribution of clergy described in a recent GCSRW report that examined the gender pay gap between clergywomen and clergymen.
Of the 305 General Conference delegates for 2019 that are women, 40.5% are clergy delegates, and 59.5% are lay delegates. Of the 129 annual conferences, 46 (36%) of them have 50% or more women in their delegation (bolded in the Appendix). Five annual conferences do not have any women delegates: Bicol Philippines, Kasai, Malawi Provisional, Quezon City Philippines, and West Congo.
| Gender Distribution of Clergy and Lay Delegates by Jurisdiction/Central Conference 3 | ||||
|---|---|---|---|---|
| Male | Female | |||
| % | n | % | n | |
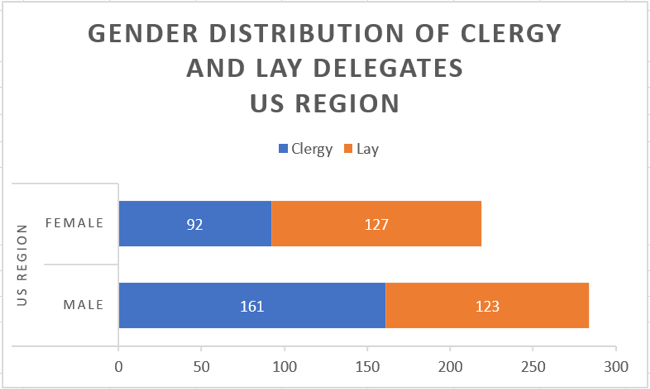
| US REGION - ALL | ||||
| Clergy | 63.6% | 161 | 36.4% | 92 |
| Lay | 49.0% | 123 | 50.6% | 127 |
| North Central | ||||
| Clergy | 60.9% | 28 | 39.1% | 18 |
| Lay | 43.5% | 20 | 56.5% | 26 |
| Northeastern | ||||
| Clergy | 54.5% | 24 | 45.5% | 20 |
| Lay | 35.7% | 15 | 64.3% | 27 |
| South Central | ||||
| Clergy | 70.4% | 38 | 29.6% | 16 |
| Lay | 57.4% | 31 | 40.7% | 22 |
| Southeastern | ||||
| Clergy | 64.9% | 61 | 35.1% | 33 |
| Lay | 52.7% | 49 | 47.3% | 44 |
| Western | ||||
| Clergy | 66.7% | 10 | 33.3% | 5 |
| Lay | 50.0% | 8 | 50.0% | 8 |
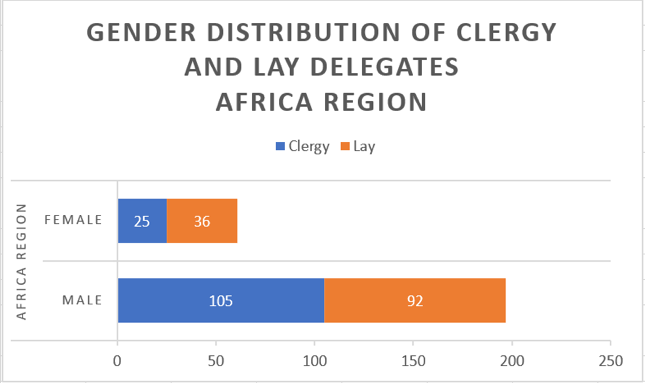
| AFRICA REGION - ALL | ||||
| Clergy | 80.8% | 105 | 19.2% | 25 |
| Lay | 71.3% | 92 | 27.9% | 36 |
| Africa | ||||
| Clergy | 71.4% | 15 | 28.6% | 6 |
| Lay | 47.6% | 10 | 52.4% | 11 |
| West Africa | ||||
| Clergy | 82.5% | 33 | 17.5% | 7 |
| Lay | 75.0% | 30 | 25.0% | 10 |
| Congo | ||||
| Clergy | 82.6% | 57 | 17.4% | 12 |
| Lay | 76.5% | 57 | 17.4% | 12 |
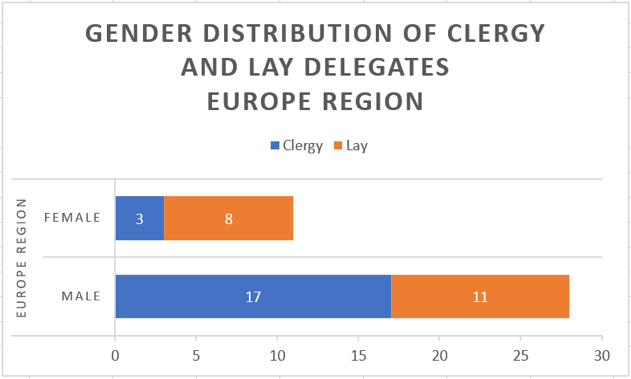
| EUROPE REGION - ALL | ||||
| Clergy | 85.0% | 17 | 15.0% | 3 |
| Lay | 57.9% | 11 | 42.1% | 8 |
| Central/Southern Europe | ||||
| Clergy | 100% | 7 | 0.0% | 0 |
| Lay | 42.9% | 3 | 57.1% | 4 |
| Germany | ||||
| Clergy | 66.7% | 2 | 33.3% | 1 |
| Lay | 66.7% | 2 | 33.3% | 1 |
| Northern Europe/Eurasia | ||||
| Clergy | 80.0% | 8 | 20.0% | 2 |
| Lay | 66.7% | 6 | 33.3% | 3 |
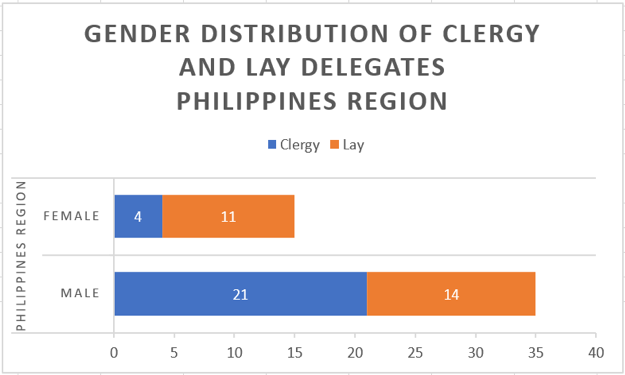
| PHILIPPINES - ALL | ||||
| Clergy | 84.0% | 21 | 16.0% | 4 |
| Lay | 56.0% | 14 | 44.0% | 11 |
| ALL CENTRAL CONFERENCES | ||||
| Clergy | 81.7% | 143 | 18.3% | 32 |
| Lay | 67.6% | 117 | 31.8% | 55 |
Clergy and Lay Delegates, By Region
In each of the regions of The United Methodist Church represented at General Conference, women fall below 50% of the General Conference delegates. The most substantial disparities in gender representation are among delegates from Central Conference regions.
Across Central Conference regions, women constitute only
25% of General Conference delegates.
Call to Action
In the spring of 2019, Annual Conferences will begin electing delegates to the 2020 General Conference. As we look at the representation of the delegates at the 2019 General Conference, the General Commission on the Status and Role of Women reminds all voting delegates to Annual Conferences to vote for an inclusive slate of delegates that represents the membership of your conference in deciding the laws, budget, and programming for the denomination. In a church with over sixty percent of the members being women, can we do better in 2020 than thirty-six percent?
Special thanks to the General Commission on General Conference for the collection of data used in this analysis.
> > > > >
> > > > >
| Gender Distribution of 2019 Delegates (Clergy and Lay) by Annual Conference | ||||
|---|---|---|---|---|
| Annual Conference | Women | Men | ||
| % | n | % | n | |
| ALABAMA-WEST FLORIDA | 60% | 6 | 40% | 4 |
| ALASKA | 50% | 1 | 50% | 1 |
| ARKANSAS | 50% | 4 | 50% | 4 |
| AUSTRIA PROVISIONAL | 50% | 1 | 50% | 1 |
| BALTIMORE-WASHINGTON | 50% | 6 | 50% | 6 |
| BICOL PHILIPPINES | 0% | 0 | 100% | 2 |
| BULACAN PHILIPPINES | 0% | 0 | 100% | 2 |
| Bulgaria-Romania Provisional | 50% | 1 | 50% | 1 |
| Burundi | 37% | 3 | 63% | 5 |
| CALIFORNIA-NEVADA | 17% | 1 | 83% | 5 |
| CALIFORNIA-PACIFIC | 63% | 5 | 37% | 5 |
| CENTRAL CONGO | 20% | 1 | 80% | 4 |
| Central Luzon Philippines | 0% | 0 | 100% | 2 |
| CENTRAL NIGERIA 4 | 17% | 1 | 83% | 5 |
| CENTRAL RUSSIA | 0% | 0 | 100% | 2 |
| CENTRAL TEXAS | 37% | 3 | 63% | 5 |
| CONCORDAT* = 10 DELEGATES | - | - | - | - |
| Côte D’Ivoire | 18% | 6 | 82% | 28 |
| CZECH & SLOVAK REP | 50% | 1 | 50% | 1 |
| DAKOTAS | 100% | 2 | 0% | 0 |
| DENMARK | 50% | 1 | 50% | 1 |
| DESERT SOUTHWEST | 0% | 0 | 100% | 2 |
| EAST AFRICA | 25% | 1 | 75% | 3 |
| EAST CONGO | 17% | 2 | 83% | 10 |
| EAST MINDANAO PHILIPPINES5 | 100% | 2 | 0% | 0 |
| EAST OHIO | 42% | 5 | 58% | 7 |
| East Zimbabwe | 50% | 2 | 50% | 2 |
| EASTERN ANGOLA | 50% | 1 | 50% | 1 |
| EASTERN PENNSYLVANIA | 75% | 6 | 25% | 6 |
| Eastern Russia-Central Asia Provisional | 100% | 2 | 0% | 0 |
| ESTONIA | 0% | 0 | 100% | 2 |
| FINLAND-FINNISH PROV | 0% | 0 | 100% | 1 |
| FINLAND-SWEDISH PROV | 0% | 0 | 100% | 2 |
| FLORIDA | 56% | 10 | 44% | 8 |
| GERMANY EAST | 0% | 0 | 100% | 2 |
| GERMANY NORTH | 50% | 1 | 50% | 1 |
| GERMANY SOUTH | 50% | 1 | 50% | 1 |
| GREAT PLAINS | 50% | 6 | 50% | 6 |
| GREATER NEW JERSEY | 88% | 7 | 12% | 1 |
| HOLSTON | 50% | 6 | 50% | 6 |
| HUNGARY PROV | 0% | 100% | 2 | |
| ILLINOIS GREAT RIVERS | 40% | 4 | 60% | 6 |
| INDIANA | 50% | 8 | 50% | 8 |
| IOWA | 50% | 6 | 50% | 6 |
| KASAI | 0% | 100% | 2 | |
| KENTUCKY | 30% | 3 | 70% | 10 |
| KIVU | 50% | 1 | 50% | 1 |
| Liberia | 25% | 3 | 75% | 9 |
| LOUISIANA 7 | 50% | 4 | 50% | 4 |
| LUKOSHI | 22% | 3 | 78% | 11 |
| Malawi Provisional | 0% | 0 | 100% | 2 |
| MEMPHIS | 25% | 1 | 50% | 3 |
| MICHIGAN | 75% | 6 | 25% | 2 |
| MIDDLE PHILIPPINES | 50% | 1 | 50% | 1 |
| MINDANAO PHILIPPINES | 50% | 1 | 50% | 1 |
| MINNESOTA | 50% | 2 | 50% | 2 |
| MISSISSIPPI | 33% | 4 | 67% | 8 |
| MISSOURI | 33% | 4 | 67% | 8 |
| Mountain Sky | 22% | 2 | 78% | 7 |
| MOZAMBIQUE NORTH | 50% | 1 | 50% | 1 |
| MOZAMBIQUE SOUTH | 50% | 3 | 50% | 3 |
| NEW ENGLAND | 50% | 3 | 50% | 3 |
| NEW MEXICO | 0% | 100% | 2 | |
| NEW YORK | 37% | 3 | 63% | 5 |
| NORTH ALABAMA | 25% | 2 | 75% | 6 |
| NORTH CAROLINA | 44% | 7 | 56% | 9 |
| North Central Philippines | 50% | 1 | 50% | 1 |
| NORTH GEORGIA | 24% | 16 | 76% | 16 |
| NORTH KATANGA | 12% | 6 | 88% | 42 |
| NORTH TEXAS | 40% | 4 | 60% | 6 |
| NORTH-WEST KATANGA | 20% | 2 | 80% | 8 |
| Northeast Luzon Philippines | 0% | 0 | 100% | 2 |
| Northeast Philippines | 0% | 0 | 100% | 2 |
| NORTHERN ILLINOIS | 50% | 3 | 50% | 3 |
| Northern Nigeria | 25% | 1 | 75% | 3 |
| Northern Philippines | 0% | 0 | 100% | 2 |
| NORTHWEST MINDANAO PHILIPPINES | 50% | 1 | 50% | 1 |
| Northwest Philippines | 50% | 1 | 50% | 1 |
| NORTHWEST RUSSIA PROVISIONAL | 50% | 1 | 50% | 1 |
| NORTHWEST TEXAS | 25% | 1 | 75% | 3 |
| NORWAY | 50% | 1 | 50% | 1 |
| OKLAHOMA | 29% | 4 | 71% | 10 |
| OKLAHOMA INDIAN MISSIONARY | 50% | 1 | 50% | 1 |
| OREGON-IDAHO | 100% | 2 | 0% | 0 |
| ORIENTAL AND EQUATOR | 0% | 0 | 100% | 2 |
| PACIFIC NORTHWEST | 100% | 2 | 0% | 0 |
| PALAWAN PHILIPPINES | 50% | 1 | 50% | 1 |
| PAMPANGA PHILIPPINES | 50% | 1 | 50% | 1 |
| Pangasinan Philippines | 0% | 100% | 2 | |
| PENINSULA-DELAWARE | 25% | 1 | 75% | 3 |
| PHILIPPINES | 0% | 0 | 100% | 2 |
| Philippines-Cavite (PACC) | 50% | 1 | 50% | 1 |
| POLAND | 0% | 0 | 100% | 2 |
| Quezon City Philippines East | 0% | 0 | 100% | 2 |
| RED BIRD MISSIONARY | 50% | 1 | 50% | 1 |
| RIO TEXAS | 40% | 4 | 60% | 6 |
| Rizal Philippines East | 0% | 0 | 100% | 2 |
| Serbia-Macedonia Provisional | 0% | 0 | 100% | 2 |
| SIERRA LEONE | 33% | 4 | 67% | 8 |
| SOUTH AFRICA PROVISIONAL | 50% | 3 | 50% | 3 |
| SOUTH CAROLINA | 37% | 6 | 63% | 10 |
| SOUTH CONGO | 14% | 2 | 86% | 12 |
| SOUTH GEORGIA | 12% | 1 | 88% | 7 |
| South Nueva Ecija Philippines | 0% | 0 | 100% | 2 |
| SOUTH-WEST KATANGA | 33% | 2 | 67% | 4 |
| Southern Nigeria 8 | 17% | 2 | 83% | 10 |
| SOUTHERN RUSSIA PROV | 0% | 0 | 100% | 2 |
| Southern Tagalog Provisional Philippines | 50% | 1 | 50% | 1 |
| SOUTHWEST PHILIPPINES | 50% | 1 | 50% | 1 |
| SUSQUEHANNA | 50% | 5 | 50% | 5 |
| Switzerland-France-North Africa | 50% | 1 | 50% | 1 |
| TANGANYIKA | 37% | 3 | 63% | 5 |
| Tanzania | 67% | 4 | 33% | 2 |
| Tarlac Philippines | 50% | 1 | 50% | 1 |
| TENNESSEE | 37% | 3 | 63% | 5 |
| TEXAS 9 | 18% | 3 | 82% | 14 |
| UKRAINE-MOLDAVA PROVISIONAL | 0% | 0 | 100% | 2 |
| UPPER NEW YORK | 50% | 6 | 50% | 6 |
| VIRGINIA | 50% | 11 | 50% | 11 |
| VISAYAS PHILIPPINES | 50% | 1 | 50% | 1 |
| WEST CONGO 10 | 0% | 0 | 100% | 1 |
| WEST MIDDLE PHILIPPINES | 50% | 1 | 50% | 1 |
| WEST OHIO | 31% | 5 | 69% | 11 |
| WEST VIRGINIA | 67% | 4 | 33% | 2 |
| West Zimbabwe | 50% | 1 | 50% | 1 |
| WESTERN ANGOLA | 40% | 4 | 60% | 6 |
| WESTERN NORTH CAROLINA | 55% | 11 | 45% | 9 |
| WESTERN PENNSYLVANIA | 50% | 6 | 50% | 6 |
| WISCONSIN | 50% | 3 | 50% | 3 |
| ZAMBIA | 17% | 1 | 83% | 5 |
| Total | 36% | 306 | 64% | 544 |