By: Amanda Mountain
Last month GCSRW reported that 27% of all United Methodist clergy are women and 73% of clergy are men. This month Women by the Numbers takes a closer look at race and ethnicity of United Methodist clergy and how it compares to that of United Methodist churches and the U.S. population.
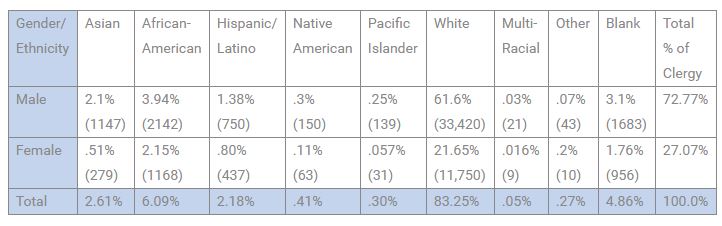
Table 1
Clergy population by gender and racial-ethnic background, 2014
Breakdown by ethnicity/race
According to 2014 numbers from GCFA (Table 1), 83.25% of all clergy are white, 12% are people of color. The largest ethnic groups are African-American/Black at 6% followed by Asian (2.6%) and Hispanic/Latino (2%). All other race/ethnicity categories are less than 1% each and together total less than 1%. The remaining 4.8% did not give their race/ethnicity.
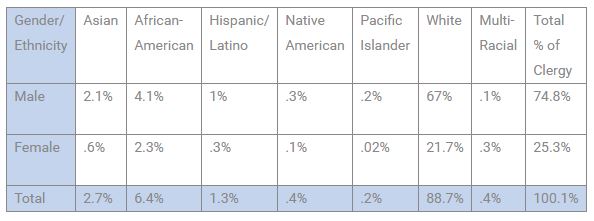
Table 2
Clergy population by gender and racial-ethnic background, 2011
Comparison to 2011
In 2011, 88.7% of all clergy were white (67% were white men and 21.7% were white women). Clergywomen of color grew from 4% of all clergy in 2011 to 5.4% in 2014.
Compared to 2011 numbers, the 2014 number of Asian American clergy remains about the same, as does Native Americans, Pacific Islanders and multi-racial clergy. The categories of “other” or “blank” were not included in 2011 reports. The number of African American clergy dropped slightly from 6.4% in 2011 to 6% in 2014. The number of white male clergy dropped from 2011 to 2014, while the number of white female clergy remained about the same at around slightly over 21%.
Breakdown by gender, district superintendents:
When looking just at the racial/ethnic breakdown of the 27% of female clergy, 80% of clergywomen are white, 8% are African American, 3% are Hispanic/Latino and 1.8% are Asian. Clergymen are similar with 85% white, 5.4% African American, 3% Asian and 2% Hispanic/Latino.
In 2014, 33% of district superintendents were women compared to 27% of all clergy that are female. Seventy five percent of the female district superintendents are white, which is similar to the percentage of white clergywomen. However, 25% of district superintendents are women of color, which is a far higher percentage than the 5.5% of all female clergy who are women of color.
In addition, 67% of district superintendents are men compared to 73% of all clergy that are men. Eighty one percent of male district superintendents are white, which is almost equally representative of the 85% of white male clergy; and 19% of district superintendents are men of color, which is higher than the overall number of male clergypersons of color.
Breakdown by clergy status, race/ethnicity
In 2014, 85% of elders in full connection are white, 7% are African American, 4% are Asian, 2% are Hispanic/Latino and 1% reported being in the other category.
Ninety one percent of deacons in full connection are white, 3% are African American, 1.5% are Asian, 1% are Hispanic/Latino, and fewer than 1% are other (3% left the category “blank”).
Considering local pastors, 74% of full-time local pastors are white, 4.6% are African American, 5% are Hispanic/Latino and 2% are Asian. Fewer than 1% are other races/ethnicities (13% left the response “blank”). Also, 70% of part-time local pastors are white, 9% are African American, 3.6% are Hispanic/Latino, 1% are Asian and 1% comprise other categories with 14.5% not answering the question.
Breakdown of ethnicity/race in United Methodist churches in the U.S.A. (Table 3)

When comparing United Methodist churches with United Methodist pastors, clergy are more diverse overall than United Methodist churches (Table 3). Ninety percent of United Methodist churches are white compared to the 83.25% of all clergy who are white, 7% are African American/Black, 1% are Asian, 1% are Hispanic/Latino, and fewer than 1% are multi-racial, native American, pacific islander or “other.”
Demographics of the U.S. population
According to the U.S. Census Bureau, the population of U.S.A. was 316,128,839 citizens in 2013. Females comprised 50.8% of Americans, which is similar to the percentage within United Methodist membership. The U.S. population was 77.7% white, 13.2% African American/Black, 1.2% American Indian and Alaska Native, 5.3% Asian, .2% Pacific Islander, 2.4% multi-racial and 17.1% Hispanic/Latino.
Comparing this to UM clergypersons, the percentage of white clergypersons (83%) is not that much higher than the 77.7% of Americans who are white.
The total percentage of African Americans in the U.S. is almost double (13.2%) in comparison to the overall percentage of African American United Methodist clergypersons (7%). The percentage of Asians (5.3%) is also double that of the 2.61% of United Methodist clergy who are Asian. The United Methodist clergy also does not reflect the 17.1% of Hispanic/Latino Americans with only 2.18% United Methodist clergy identifying as Hispanic/Latino. Overall United Methodist clergy are not representative of the U.S. population.
In addition, the U.S. Census Bureau’s predictions states, “By 2042, racial-minority groups will make up the majority of the U.S. population.” According to the Pew Research Center’s study The Next America, “white Americans will have gone from making up 85% of the population in 1960 to 43% in 2060.” United Methodist clergy do not currently mirror the ethnic/racial composition of the U.S. population and the United Methodist churches do not reflect the U.S. population.
Future clergy (provisional deacons and elders, not necessarily younger clergy):
Of provisional elders, 68% are white, 7% are African American/Black, 4% are Asian, 3% are Hispanic/Latino, less than 1% are within the other category and 16.8% didn’t answer. Of provisional deacons, 59% are white, 6% are people of color, and 35% did not answer.
It seems future clergy (68% provisional elders and 59% provisional deacons) might become slightly more reflective of the U.S. population (77% white in 2013 to projected 43% white in 2060), but still not reflective of the growing number or racial/ethnic minorities in the United States.
Retired clergy
Among United Methodist retired clergy, 93% are white, 3.8% are African American, 2% are Asian, less than 1% are Hispanic/Latino, and less than 1% are other races/ethnicities or did not answer the question.
Conclusion
The data shows that the overall numbers comparing the race/ethnicity of United Methodist clergy are roughly the same from 2011 to 2014.
To read the Pew research report, The Next America, go here: http://www.pewresearch.org/next-america/
To read statistics about the changing US population demographics, visit this page: http://www.huffingtonpost.com/2014/04/13/changing-racial-makeup-_n_5142462.html