In the next few months, “Women by the Numbers” will look at the racial/ethnic backgrounds of UMC clergy in the United States. In Part I, we will examine how clergy of color are spread geographically.
Overall diversity
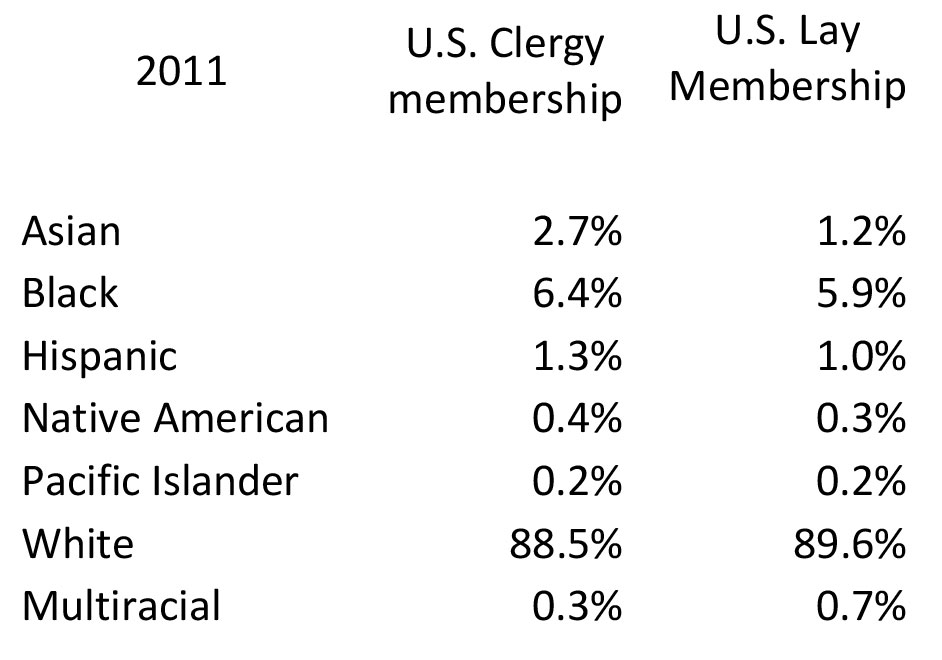
According to the General Council of Finance and Administration, the U.S. membership of The United Methodist Church is 7,526,642. White people make up the majority of the lay membership as well as the majority of the clergy – women and men -- with near parity. The table below shows the representation of clergy membership to lay membership within the racial/ethnic categories that are recognized by the UMC.
Diversity increases in The United Methodist Church
In 2011, as reported in December’s “Women by the Numbers,” the church had seen little change in the number of clergy since 2006. However, the percentage of clergy of color rose. In 2006, whites were 89.4% percent of clergy, while people of color were 10.5%. In 2011, white clergy membership declined to 88.5%, while the percent of clergy of color increased to 11.3%. Though only .8 of a percentage point higher, that means that the number of clergy of color have risen by 7.6% over 5 years and are proportionally representing their respective backgrounds nationally.

Overall, Black clergy membership rose by 4%; Asian by 7%, and Hispanic by 16%. Native American clergy membership decreased by 5%, Pacific Islander clergy by 4%, and White clergy by 1%.
Multiracial clergy saw the greatest percentage increase from 2006 to 2011. The numbers increased to 151 from 42, a net gain of 109 or a whopping 260%. The increase in multiracial clergy represents a willingness of the UMC to accept multi-racial clergy, but also a level of comfort and acceptance by multiracial clergy to acknowledge themselves as multiracial.
Most diverse conferences
The increase in diversity at the national level reflects a growing increase in the diversity of our individual conferences. In 2006, only two annual conferences reported having at least one clergyperson from each racial/ethnic background: Missouri (South Central Jurisdiction) and California-Pacific (Western Jurisdiction).
By 2011, six annual conferences reported having at least one clergyperson from each racial/ethnic background: Upper New York (Northeastern Jurisdiction), Louisiana and Oklahoma (South Central Jurisdiction); North Alabama and North Carolina (Southeastern Jurisdiction) and California-Pacific (Western Jurisdiction). Missouri barely missed making the list this time by having racial/ethnic clergy in all categories but one. In fact, 15 annual conferences (including Missouri) had racial/ethnic clergy persons in all categories except one in 2011.
We determined the conferences with the most diverse clergy using three criteria:
- at least 5 of the 7 racial-ethnic categories were represented
- 4 or more of the Racial-Ethnic categories were represented at greater than 1%
- No single category was represented at higher than 75%.
Using these parameters, in 2006, the conferences with the most diversity were Baltimore-Washington, California-Nevada, California-Pacific, New York, and Peninsula Delaware. In 2011, the most diverse conferences were mostly the same: Baltimore-Washington, California-Nevada, California-Pacific, New York, and Northern Illinois. However, the diversity is no longer confined to just the Western and Northeastern Jurisdictions. The addition of Northern Illinois moves it into the North Central Jurisdiction as well.
Given the large percentage of UMC members who are White, it is not surprising that some annual conferences have little diversity. However, GCSRW advocates for each annual conference clergy membership to reflect its lay membership proportionally, as has happened within the church in the United States at large.
Concentration of each racial-ethnic category
Last, we look at the conferences with the highest percentage of clergy in each single racial-ethnic category.

Discussion
Why is diversity important in the context of representation among leaders and authority figures?
What does diversity contribute to Christianity? United Methodism?
How does diversity affect the decision making and spiritual growth of your Annual Conference?
(You can respond on our Facebook page – facebook.com/gcsrw – or by emailing us at info@gcsrw.org)
Next Month
Racial/Ethnic Backgrounds Part II: Where are racial-ethnic categories represented among the seven clergy categories? And Coming Up: Racial/Ethnic Backgrounds Part III: After having set the foundation of basic gender and racial statistics, we will take a look specifically at women of color and their status and role within the UMC.