This month we examine racial-ethnic groups by clergy status. The United Methodist Church has seven categories of clergy status: Deacons in Full Connection, Elders in Full Connection, Provisional Deacons, Provisional Elders, Associate Members, Full-Time Local Pastors, and Part-Time Local Pastors. The vast majority of clergy (nearly 72%) are ordained as Elders in Full Connection. The fewest are Provisional Deacons (less than 1%) as they are in a transitional phase. When we look at where racialethnic background and ordination status intersect, we see a very interesting dispersal.
Table 1 below shows what percent of each racial-ethnic group are ordained in which clergy positions. (For example, 1% of the Asian clergy are Deacons in Full Connection, and 79 percent of Asian clergy are Elders in Full Connection).
Table 1
Racial-Ethnic Group by Clergy Category

As Table 1 shows, clergy from nearly every racial-ethnic group are most likely to be ordained as Elders in Full Connection, reflecting the national pattern of ordination for the church; however, many groups are over- or under-represented compared to the total numbers. The second largest clergy status for nearly all racial-ethnic groups is that of Part-Time Local Pastors (and is the largest for multiracial clergy), again reflecting the total trend. However, clergy ordained as Elders in Full Connection dropped from 2006 to 2011, while Part-Time Local Pastors’ numbers rose.
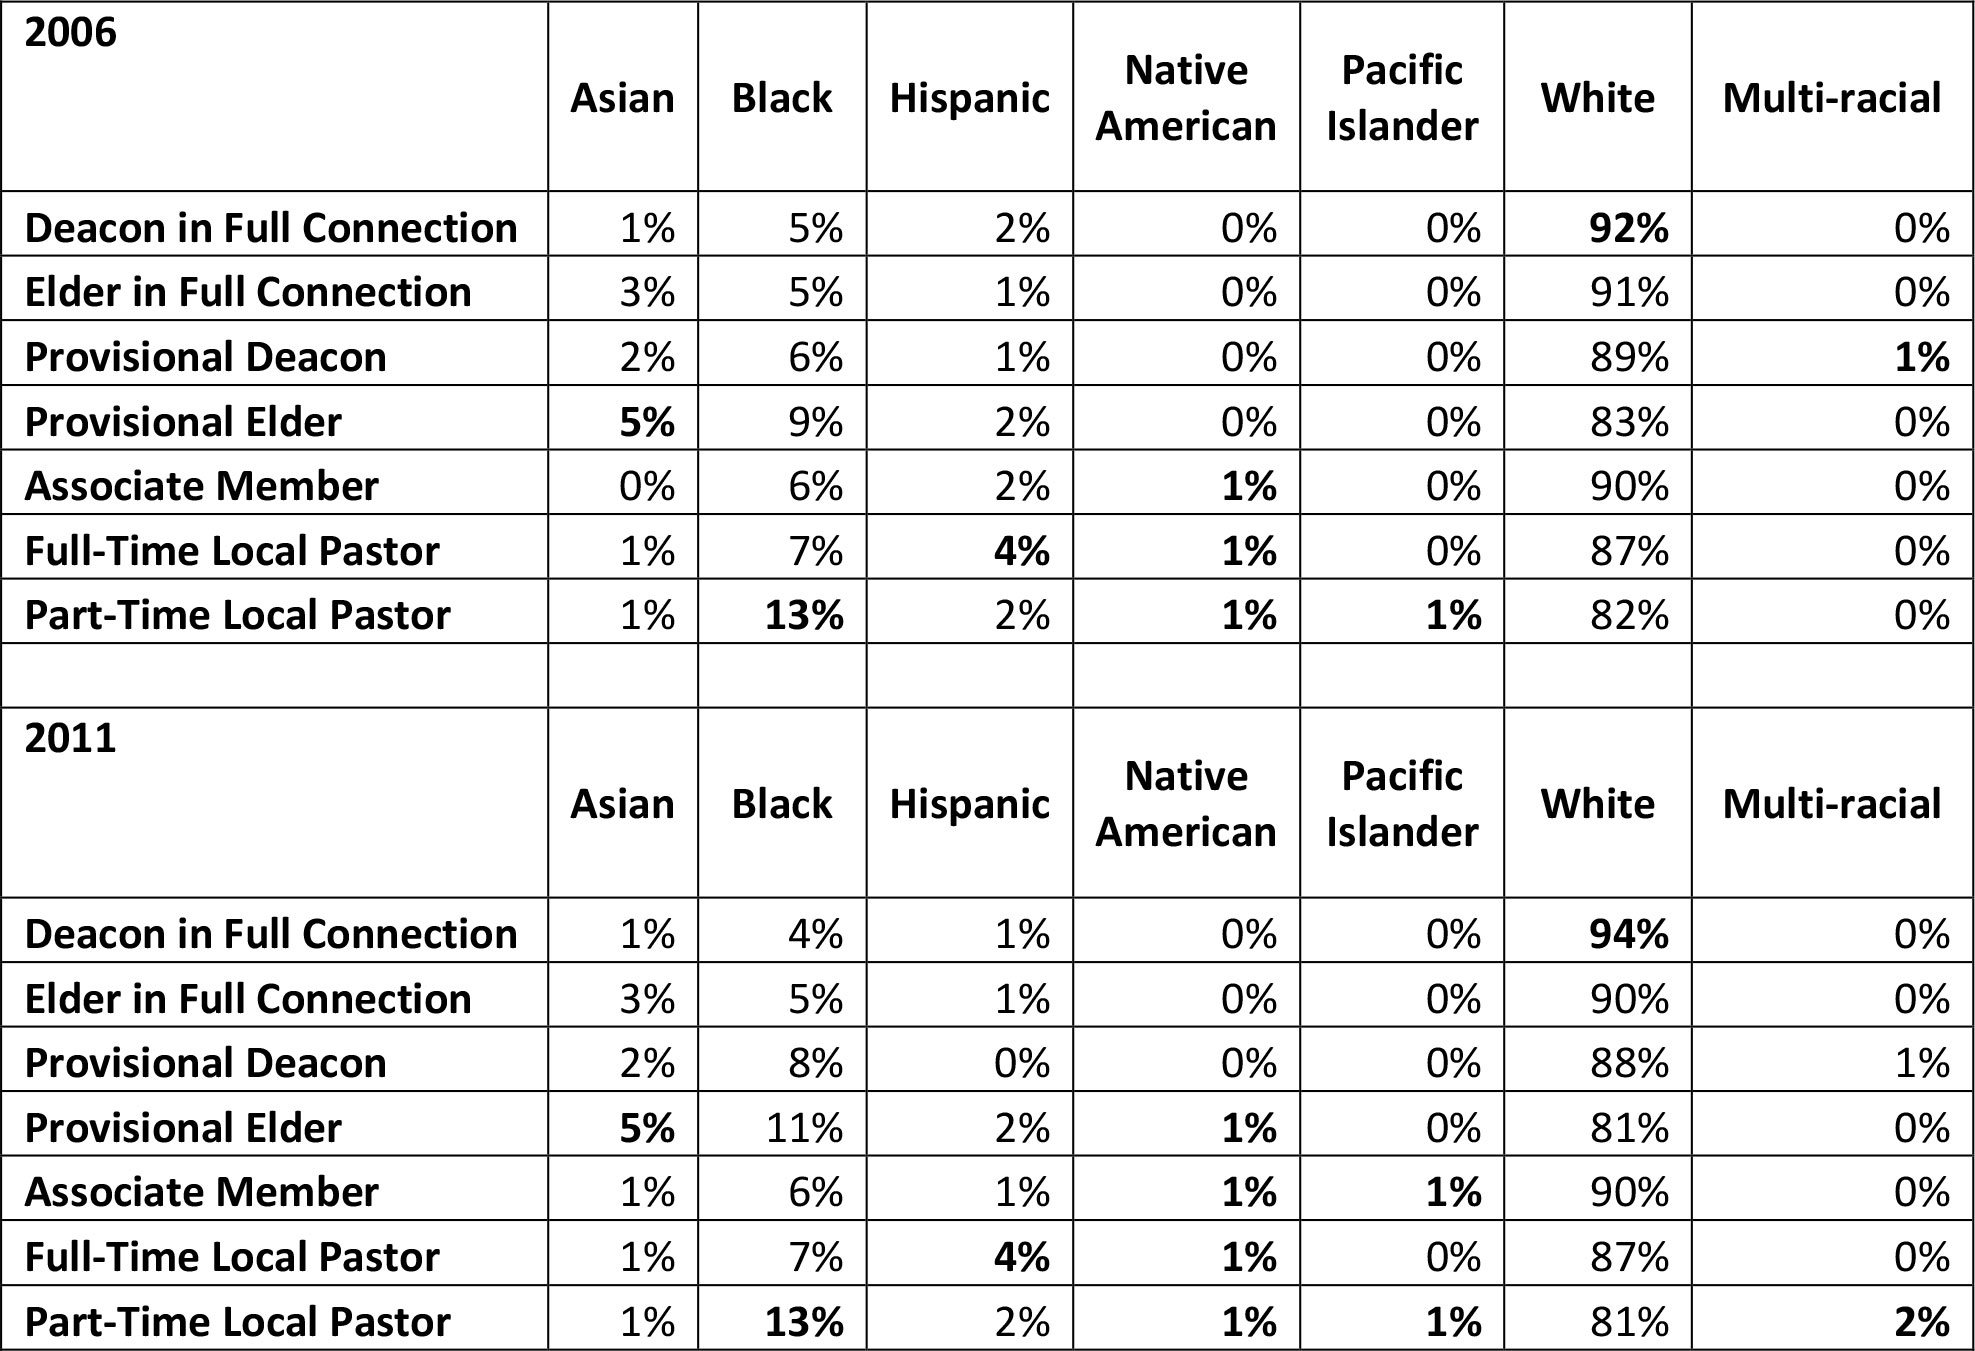
When we look to see how each clergy category is made up by Racial-Ethnic group, we see another picture of diversity in leadership. Table 2 shows that Deacons in Full Connection make up the least diverse category of clergy within The United Methodist Church. In 2011, the mix became even more homogenous (of all the Deacons in Full Connection in 2011, 94% are White, 4% are Black, 1% are Hispanic and 1% are Asian). The most diverse category of clergy in 2006 and 2011 was that of Part-Time Local Pastors.
Table 2
Clergy Category by Racial/Ethnic Group
Discussion
What do these numbers tell us about United Methodist leadership?
What does your local area clergy leadership look like compared to the total demographics in Table 1? What does your local leadership look like compared to leadership demographics in other institutions in your area?
Why might Part Time Local Pastor numbers be growing in comparison to other clergy categories?
What factors might lead some racial-ethnic groups to be over or under represented among certain clergy categories? Do all people get the same encouragement/support to go into ministry?
Next Month
Women by the Numbers examines clergy categories, compensation, and gender and racial diversity.