Bishops serve in our church’s highest leadership role, providing spiritual and institutional guidance both within their Annual Conference and across the connection. Given bishops’ importance to the well-being and direction of the church, it seems important that a diversity of perspectives and experiences be represented among them.
What’s more, the possibility that a diverse array of churchgoers might find themselves represented among UMC bishops is not insignificant: the ability to imagine oneself in a particular leadership role can help to encourage individuals to pursue a vocational calling. This post initiates a series that will explore the gender and racial demographics of our bishops, as well as how those demographics compare with other UMC leadership roles and the impact of a given bishop’s gender and racial/ethnic identity on the presence of historically underrepresented groups in other leadership roles. First, however, we’ll look at the demographics of bishops themselves.

The majority of bishops are men: 72% of bishops are male and 28% are female. While these statistics mean that almost one-third of bishops are female, we must consider the context of the church. Among laity, women represent 58% of the UMC. The fact that representation among bishops lags behind the portion of women in the church could arise from several factors, not least among them the reality that fewer women seek ordination as an elder than men do. But even this smaller pool of potential female candidates for bishop should give pause: does God call fewer women to ordained ministry, or do particular features of our church and society – whether belief, tradition, practice, or policy – coalesce to discourage women from following their call, or, once ordained, from being willing to take a leadership role that might lead to becoming a bishop? Do the structures and policies of our church foster women’s full participation in the leadership of the church?
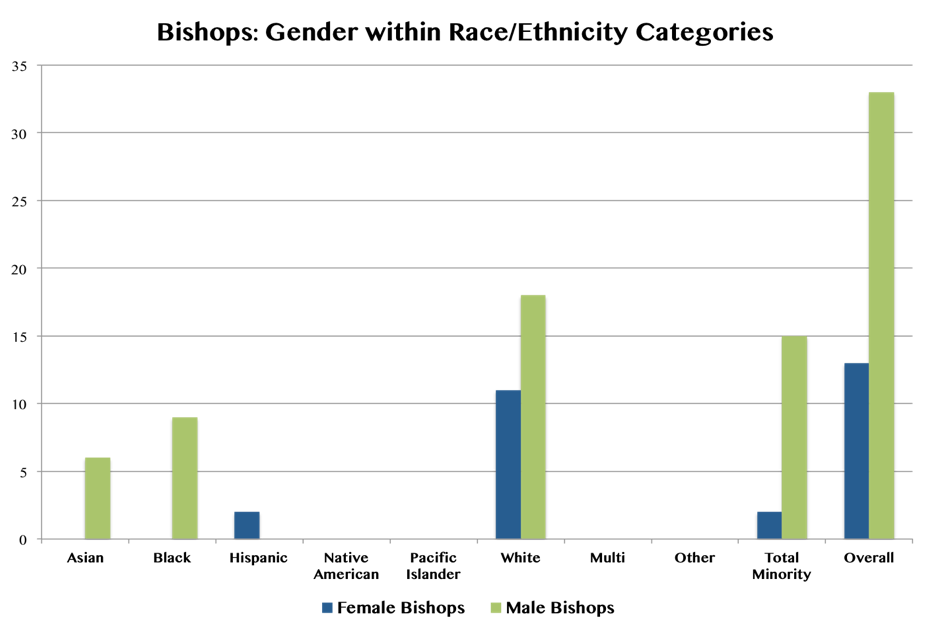
Bishop demographics introduce a divergence from patterns we have encountered among other leadership groups. Rather than a stronger proportion of women among bishops, we find a larger collective presence of those who identify with non-white racial/ethnic groups: 37% of bishops identify with a minority racial/ethnic group, nearly ten percent more than are women. The more detailed race/ethnicity chart does, however, illustrate that some groups are missing, and that much of the diversity is found through the presence of Asian (13%) and Black (20%) bishops. The remaining 4% are Hispanic. Finally, 63% of bishops are white.
Although female bishops are less present by proportion than women in the church writ large, bishops have advanced racial/ethnic diversity within their ranks. The final chart depicts male and female bishops for each racial/ethnic identity category recorded by the church. Green columns show the presence of male bishops; blue columns show the presence of female bishops. The chart starkly illustrates categories in which bishops are absent: Native American, Pacific Islander, Multiracial, and Other. It similarly reveals a clear picture of female bishops: almost all are white, with a very few who identify as Hispanic. With the exception of Hispanic bishops, there are more male than female bishops in every racial/ethnic identity category in which any bishops appear. Notice as well that the number of male minority bishops is closer to the number of male white bishops than the total number of female bishops (see the “Overall” category on the rightmost side of the chart). Why do women appear struggle to gain traction as bishops? Why are particular racial/ethnic identity groups missing from among the bishops?
UMC Bishops: Geographic Representation of Race & Gender
Among bishops, are historically under-represented groups – women and minority racial/ethnic identities – evenly distributed across jurisdictions? Does geography impact diversity within the ranks of bishops? Finally, how does the geographic distribution of bishops correspond with that of other annual conference leaders?

In this first chart, we see the presence (or absence) of historically under-represented groups in each jurisdiction. The purple columns reveal the percentage of bishops in a given jurisdiction who identify with a racial/ethnic minority. The percentage of female bishops in each jurisdiction are depicted by the blue columns. While most jurisdictions closely resemble one another and the overall presence of female and racial/ethnic minority bishops, the Western jurisdiction holds a significantly greater percentage of both female and racial/ethnic minority bishops. In fact, it more than doubles the percentage found in almost every other jurisdiction for both categories. Why does the percentage of both groups among bishops so sharply increase in the Western jurisdiction? Is it because of the region’s cultural norms, the demographic makeup of ordained elders in the jurisdiction, or some combination of factors? Is there more openness to the most qualified candidate, regardless of gender or race/ethnicity, or a concerted effort to ensure the presence of women and minority racial/ethnic identities among bishops – or both? Whatever the cause, although geography appears not to impact other jurisdictions, the demographics of the Western jurisdiction differ.

The next chart still attends to jurisdictional geography, but focuses on the percentage of women in a few AC leadership positions. Does geography seem to have more or less of an impact on the percentage of women among bishops, district superintendents, or AC leaders (directors of connectional ministries, treasurers, chancellors)? The chart shows us that the representation of women varies across leadership positions and jurisdictions with no clear pattern. As with bishops overall, the Western jurisdiction has the highest percentage of women among its leadership roles. It does, however, seem that overall, district superintendents and AC leaders have a higher percentage of women among their ranks than do bishops, whatever the jurisdiction. Why are women more concentrated in leadership roles other than that of bishop, regardless of geographic region? One geographic similarity emerges between the two northern jurisdictions: women are found in higher percentages among district superintendents than other roles in both northern jurisdictions. Interestingly, the reverse is true in both of the two southern jurisdictions, in which women make up a higher percentage of AC leaders than DS or bishop. All told, this chart illustrates that the representation of women in AC leadership positions varies across jurisdictions and the positions themselves without a clear pattern. What leads women’s presence in leadership roles to be so haphazard?
The final chart in this section performs the same illustration for those leaders who identify with a minority racial/ethnic group. Does geography impact their percentage among those who hold AC leadership positions? Overall we see relative consistency among the jurisdictions, with the exception of bishops in the Western jurisdiction and district superintendents in the North East. Both of these leadership categories have a higher percentage of those who identify with a minority racial/ethnic group. But the most striking feature of this chart is how clearly it shows that minority racial/ethnic groups are better represented among bishops than other leadership positions, regardless of jurisdiction.
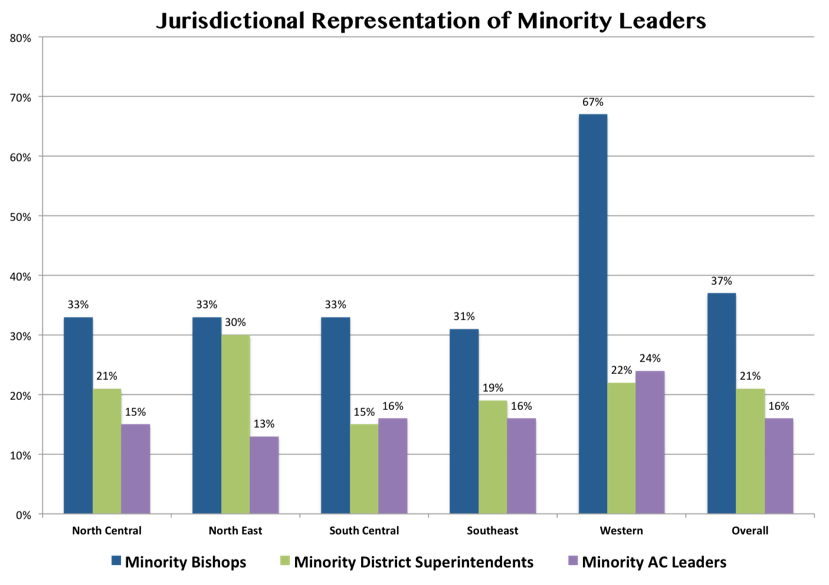
Why is it that we are more likely to find a bishop who identifies with a minority racial/ethnic group than a district superintendent or AC leader? Why does this trend hold true across jurisdictions?
UMC Bishops: Impact of Bishop Identity
Bishops play an extensive role in the appointment and election of other church leaders, often directly controlling who takes a particular position as well as recommending other candidates. Among the positions impacted by bishops are those discussed in previous posts: district superintendents, directors of connectional ministries, chancellors, and treasurers. The following charts explore relationships between bishop appointments and that of other annual conference leaders.
First, an illustration of the different identity categories represented among three annual conference leadership roles: bishops, district superintendents, and annual conference leaders (directors of connectional ministries, treasurers, and chancellors). Is there more or less diversity represented in different leadership roles?
This chart certainly confirms the reality that the majority of leadership positions explored in this series are held by male (the green columns on the chart) and white (turquoise columns) individuals. However, both women and those who identify with a minority racial/ethnic group occupy a robust percentage among most of the leadership positions depicted. Interestingly, the pattern of that representation shifts according to the position. A greater percentage of bishops identify with a minority racial/ethnic group (36%) than are female (28%); this pattern is reversed for both district superintendents and AC leaders (DCMs, treasurers, and chancellors), in which women make up a greater percentage of the total than do minority racial/ethnic identities. This comparison serves as a reminder that, among bishops, men identified with a minority racial/ethnic identity are more common than any race/ethnicity of woman, including white. Why are women less of a presence among bishops than they are within other leadership positions? Why are minority racial/ethnic identities not as robustly represented among district superintendents and AC leaders?

The second chart provides a glimpse into the impact that a bishop’s identity might have on diversity within other annual conference leadership roles. Each group of four columns corresponds with a different bishop identity category, while each color corresponds with a different type of annual conference leadership position. For example, the first group of four columns (on the left side of the chart) all illustrate leadership positions within annual conferences led by a bishop who identifies with a minority racial/ethnic group. The navy column tells us that 25% of the district superintendents in supervised by a minority bishop are themselves identified with a minority racial/ethnic group. The green column shows that 37% of district superintendents led by a minority bishop are women. The purple column tells us that 14% of AC leaders (DCMs, treasurers, and chancellors) with a minority bishop identify with a minority racial/ethnic group. Finally, the turquoise column shows that 30% of AC leaders led by a minority bishop are women
What’s most important in this chart, however, are not the specific numbers themselves, but how the different columns compare across groups: within each type of AC leadership position, what changes when the demographic identity of the bishop shifts?
Looking at the navy and green columns across the chart, it’s clear that minority and female bishops have a greater percentage of both minority and female district superintendents within their purview than do either white or male bishops. In other words, minority and female bishops might appoint more minority and female district superintendents, by percentage, than do white or male bishops. It may also be that minority and female bishops “inherit” this diversity among their district superintendents from a predecessor; in that case, they may oversee ACs that have a history of appointing minority and female individuals, yielding both diversity within their district superintendents and, potentially, openness to their own appointment as a bishop who identifies with a group historically under-represented among UMC bishops.
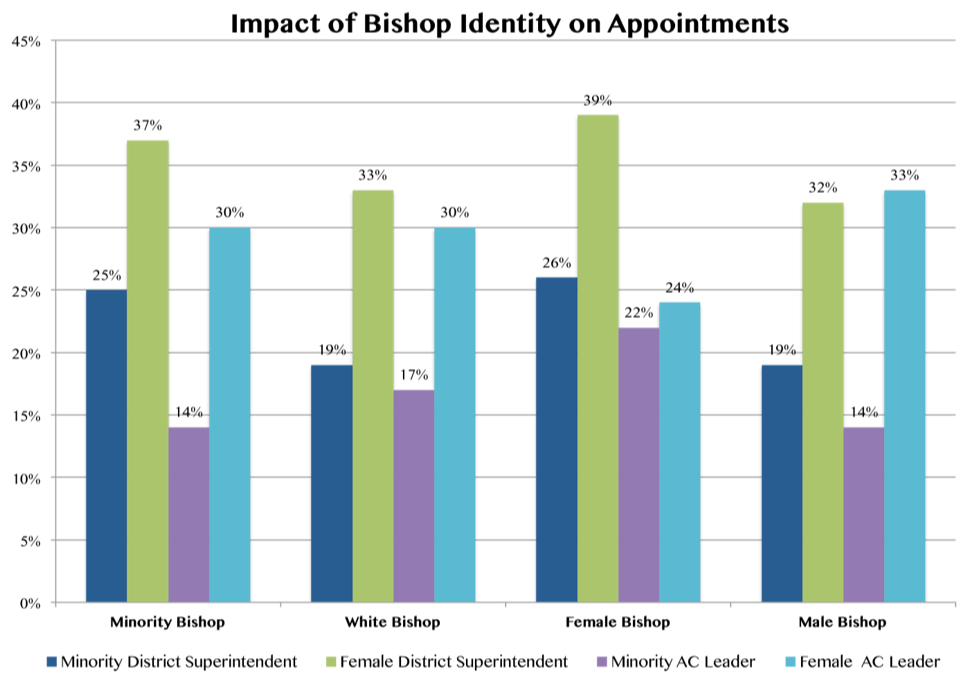
The same gain does not, however, necessarily hold with minority and female AC leaders. With AC leaders, most types of bishops have relatively similar demographic percentages. Two exceptions are worth remark: first, female bishops oversee a greater percentage of minority AC leaders than any other bishop identity investigated here; and second – and perhaps surprisingly – female bishops supervise a lower percentage of female AC leaders than other bishops.
Why should the demographic makeup of district superintendents and AC leaders have anything to do with the demographic identity of bishops? As we see in this chart, at times bishop identity does not have an impact. But this chart was created to determine if, based on descriptive statistics, it seems that bishops who themselves identify with a historically under-represented group might signal more openness to non-normative (that is, non-white or non-male) persons holding leadership roles. On the other hand, a minority or female bishop could worry about appointing too many other non-white and/or non-male leaders, erring in a normative, non-representative direction. Still another possibility is that the presence of a minority or female bishop becomes tokenized, their leadership presence suggesting to the AC that “enough” representation of historically marginalized groups has been achieved. While the chart does not provide us with enough evidence for causality in the appointment of minority and female DSs and AC leaders, or even ensure a relationship between bishop identity and such appointments, it does give us a starting point in thinking about such possibilities. Minority and female district superintendents tend to have a stronger presence by percentage when a minority or female bishop leads; might that reality correspond with the fact that bishops hold direct control over who becomes a district superintendent through their appointment, whereas the AC leaders discussed in this series are sometimes appointed, sometimes elected?