Principal Investigator: Rev. Gail Murphy-Geiss, Ph.D.

Introduction
This study looks at the first three appointments of ordained elders to determine whether there is a different early career path based on gender. Once in the professional clergy career pipeline, do the experiences of men and women differ? Do some clergy get “better” first appointments? Do some clergy move “up the ladder” more quickly than others? Who requests moves more often, and for what reasons, and who objects to them, and for what reasons? Looking back over their careers, how satisfied are clergy with their career trajectories?
Methods
In the spring of 2016, a survey was distributed via email to a random sample of United Methodist clergy, obtained through a stratified sampling technique. Because no single list of UM clergy email addresses exists, online Annual Conference journals were used to obtain names and in some cases, email addresses. Where email addresses were not provided in the journals, web pages with Annual Conference “search” tools were consulted. Every Annual Conference was included, polling the number of persons based on the number of delegates elected to General Conference times 2.5, for a total of 1260 possible participants. It is impossible to know the exact return rates since a number of emails were returned as “not valid,” although as many of those were replaced as possible. Unfortunately, there may have been others that never reached the intended parties as well.
In the end, 627 (49.8%) persons started the survey, and 579 (46%) persons completed enough of it to be included in this analysis, including indicating their gender. While 50% would constitute a good return rate, 46% is not bad. Regarding the gender breakdown of participants, 387 (66.5% of the total) men and 192 (33.5%) women completed the survey. According to a General Commission on the Status and Role of Women report from August of 2015, 27% of UM clergy are women. Hence, women are over-represented in this sample, though that is not surprising. The invitation letter mentioned the focus on gender differences, a topic which is likely to be of greater interest to women.
Because the return rate may be slightly below the ideal, and also because the gendered makeup of the sample does not match that of the clergy overall, we cannot be as sure that the responses represent the experience and opinions of the UM clergy overall. On the other hand, respondents came from a fairly large random sample and the return rate is acceptable, so the results warrant serious consideration and further investigation.
The survey asked for basic demographics, followed by an accounting of one’s first three appointments. Salaries provide one way of measuring the trajectory of a career, but in this case, salary histories were not requested. For one, they are hard to recall, but more, they are difficult to compare. While some clergy have housing allowances, others live in parsonages. While some have specified allowances for things like continuing education or attendance at Annual Conference, others do not. Minimum salaries, where they exist, vary, and of course, the differences in the cost of living between and within Conferences are even greater. Instead, we asked about levels of satisfaction in each appointment, and their feelings about each move. Finally, we asked about how they felt regarding their career trajectories and if they had ever considered leaving the ordained ministry or the United Methodist Church. All questions used for this analysis can be seen in the Appendix, absent the skip logic that was used to move respondents coherently from one question to the next.
Demographics
Statistically, there were no differences in average age by gender (men = 54.8; women = 54.7), nor were there statistically significant differences in the numbers of men and women respondents by Jurisdiction. There was also no difference in the percentages of men and women who attended UM seminaries (61.1%) and those who attended non-UM seminaries (38.9%).
The sample DID show differences for men and women regarding marital status (married men = 73.3%; married women = 26.7%), whether they had children (those with children were 92% of men and 71.9% of women), whether ministry was their first career (first career for 57.4% of the men and for 40.3% of the women), and the average number of years in a career BEFORE ministry. Those men reported an average of 6.3 years of work before ministry, while the women reported almost twice as many, at 11.9. For both men and women who worked before ministry, the most popular career was business (40.5% of men who worked, and 31.9% of women), but the second and third most popular careers differed. For men, 9.2% left a job in finance and 8.6% came from military service. For women, 22.1% left a career in education and 18.6% came to ministry from a career in the health care field
The First Appointment
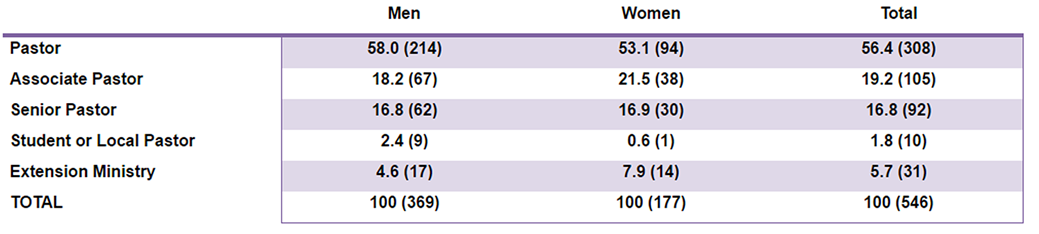
In many ways, the first appointments for men and women were reported as much the same, including the following: job title, time in appointment, and size of appointment (number of churches and number of members). First appointment titles were reported as follows:
Table 1: Percentage (n)s of First Appointments by Title

The average time in that appointment was no different on average for men (4.09 years, s.d. = 3.16) than for women (4.17 years, s.d. = 2.76). The average number of members served was also not statistically significantly different, at 536.69 for men and 515.09 for women. Similarly, the average number of churches was the same, at 1.54 for men and 1.52 for women, with about 2/3rds of all respondents serving single point charges. Interestingly though, first appointments DID differ in regard to how respondents saw them. That is, how they ranked them as average or better or worse than average in comparison with other first appointments, and also in rating their happiness. In both cases, men were more likely to say their appointments were “better” than others, and they were happier in them. Note the highlighted figures in Tables 2 and 3, in particular. In these cases, men or women had the higher response rate, and the difference is statistically significant.
Table 2: Percentage (n)s of First Appointments by Rank Against a Perceived Average

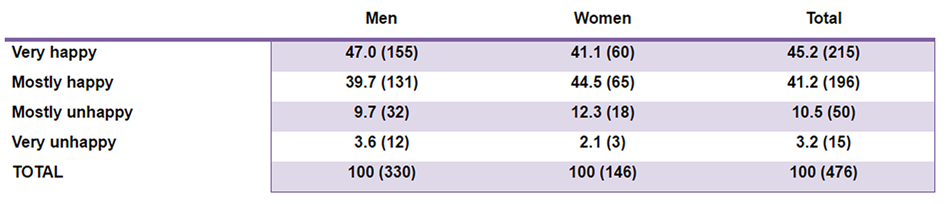
While there may be many things related to one’s “happiness” level in any particular time or place, it appears that the two are linked here. That is, where one feels one received a “better” appointment in relation to others, one is also happier in that appointment, and it appears that men win in both measures. In fact, one could say that almost half of male clergy were very happy in their first appointments, while that was true for only about a third of the women. On the flip side, if combining the numbers of people who were mostly and very unhappy, almost twice the percentage of women (16.1%) reported being unhappy compared to men (9.1%).
Table 3: Percentage (n)s of Respondents by Happiness in First Appointments

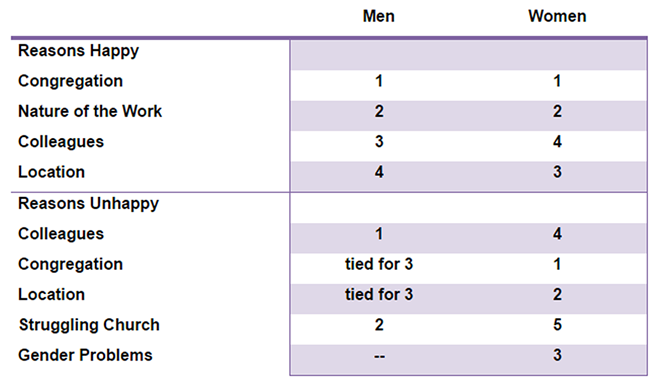
The reasons respondents cited for their happiness or unhappiness varied widely, with the top responses summarized in Table 4. The category of “colleagues” includes any clergy or church staff colleagues, but the overwhelming majority referred to supervisors, specifically senior pastors and district superintendents. Note that only women reported gender problems, not surprisingly, but it is the third most commonly cited issue related to unhappiness for women, above more general problems with colleagues and the challenges of pastoring a struggling church.
Table 4: Ranking of Top Reported Reasons for Happiness/Unhappiness in First Appointments
The Second Appointment
Like the first appointment, there were no gender differences in titles, time in appointment and number of churches/ members in the second appointment. As expected, the second appointment is marked by more senior pastors and fewer associates, but there are no differences by gender. The titles for the 546 respondents who were not still in their first appointments and had moved to a second are in Table 5.
The average time in the second appointment was no different on average for men (4.9 years, s.d. = 4.226) than for women (4.31 years, s.d. = 3.007), and for both, the average time was longer than in the first appointment. Note too that the standard deviation is greater for men in both appointments, indicating a more varied experience for men – that is, women’s reported time is closer to their average than men’s. The average number of members served was also not statistically significantly different, at 550.21 for men and 502.89 for women. Similarly, the average number of churches was the close to the same, at 1.34 for men and 1.22 for women, although the difference is approaching significance at p=.054. If indeed there is a difference, women report serving fewer churches on average, than men, in the second appointment.
Table 6: Percentage (n)s of Second Appointments Perceived as Promotions/Lateral Moves/Demotions
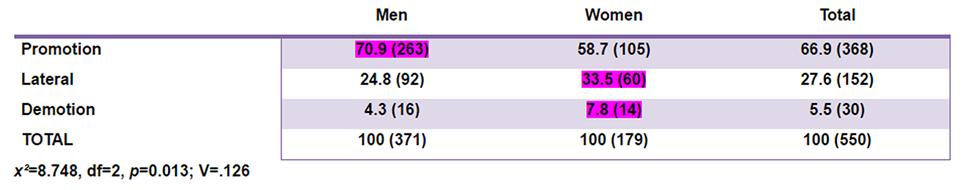
Unlike the first appointment, in the second appointment, men and women reported similar “happiness” levels, with men a little less happy than in appointment #1, and women a little more happy. In effect, men’s disappointment may be similar to women’s, but manifested later. By the time they are in their second appointments, men and women are equally happy with their placements. Those figures appear in Table 7.
Table 7: Percentage (n)s of Respondents by Happiness in Second Appointments

The reasons for happiness and unhappiness again varied, the top ranked reasons shown in Table 8. Again, while there is only a small difference between the reasons to be happy, the reasons to be unhappy are quite different because of gender problems were not reported by any men.
Table 8: Ranking of Top Reported Reasons for Happiness/Unhappiness in Second Appointments

The Third Appointment
Once again, titles and numbers of churches/members were the same across genders. Those titles and church/member numbers are reported in Table 9. Although the difference in number of members looks large, it does not reach the threshold for statistical significance (p = 0.143). Of course, that doesn’t mean there is NO difference, but only that it may be by chance in our sample, and therefore not representative of all clergy. The differences in the standard deviations for that measure also seem notable. If there IS a real difference, the number of members in men’s churches is more varied, while women’s membership numbers are closer to their mean.
Table 9: Percentage (n)s of Third Appointments by Title and Number of Churches/Members
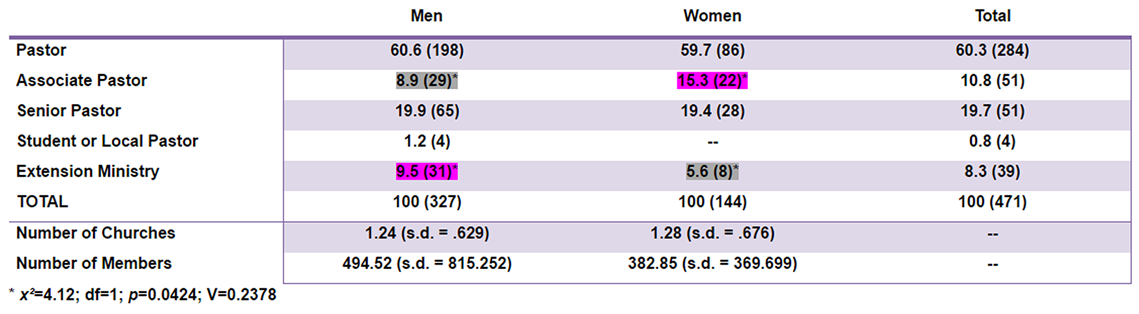
Notable above are differences between men and women as Associate Pastors and those in Extension Ministries. That is, the numbers of all clergy appointed as pastors and senior pastors is quite similar, and there are very few student/local pastors by the third appointment – too few for analysis. That means the only remaining differences are between those serving as Associates and those in Extension Ministry. Those differences ARE significant, as noted in the footnote to Table 9 and highlighted in two colors to indicate that only those categories showed a statistically significant correlation.
Unique to this appointment though is a difference in the time there. In this appointment, the average number of years served for men was 5.45 years (s.d. = 4.351) and for women was 4.11 (s.d. = 2.777). Again, men’s time is more varied and women’s is closer to their average, but this time, the difference is greater and now statistically notable. Table 10 shows the average time in all three appointments to facilitate comparison across time and gender. Note that men’s appointments start shorter than women’s, but statistically, there is no difference. In the second appointment, both men and women enjoy a longer stay, but men more than women, although again no difference statistically. By the third appointment, men are staying notably longer, partly because their time has increased steadily, while women’s increased from appointment #1 to appointment #2, but then decreased to appointment #3, which for women is the shortest appointment of all. In addition, the smaller standard deviation for women indicates a more similar experience of appointment duration, while for men, it is more varied from their average.
Table 10: Average Number of Years in First Three Appointments

Again, in this third appointment, the levels of happiness reported by men and women were similar, but their perceptions around the third appointment as a promotion or demotion are distinct, and in the same direction as in appointment #2. That is, men again feel they are being promoted more than women do, as seen in Table 11. The difference between men and women who feel they were demoted is very small, and therefore, not highlighted. Clearly the correlation is between gender and whether clergy feel they were promoted or not, and indeed, if lateral and demotion are collapsed into “not promoted,” the responses of men and women remain statistically significantly different (x²=7.68, df=1, p=0.0056; V=.14322)
Table 11: Percentage (n)s of Second Appointments Perceived as Promotions/Lateral Moves/Demotions

Once again, the happiness levels were the same for women and men, as seen in Table 12.
Table 12: Percentage (n)s of Respondents by Happiness in Third Appointments
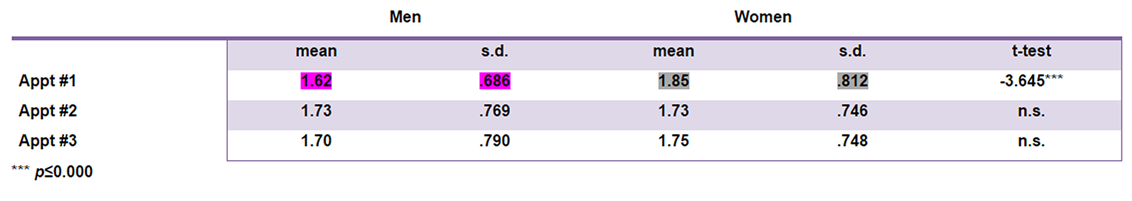
Another way to look at the levels of happiness in each appointment by gender is by comparing average “happiness” scores, on a scale of 1 (very happy) to 4 (very unhappy). Those comparisons appear in Table 13. Note that men are happier, but only in the first appointment. After that, happiness is basically the same. It is also notable that on average, the clergy as a whole are somewhere between very happy and mostly happy
Table 13: Average Happiness Scores on a Scale of 1 (very happy) to 4 (very unhappy)
Yet again, the reasons for happiness and unhappiness vary a bit, and gender matters as it did in previous appointments – very little in terms of happiness, but with gender problems prominent for women. See Table 14.
Table 14: Ranking of Top Reported Reasons for Happiness/Unhappiness in Third Appointments

The Itinerancy
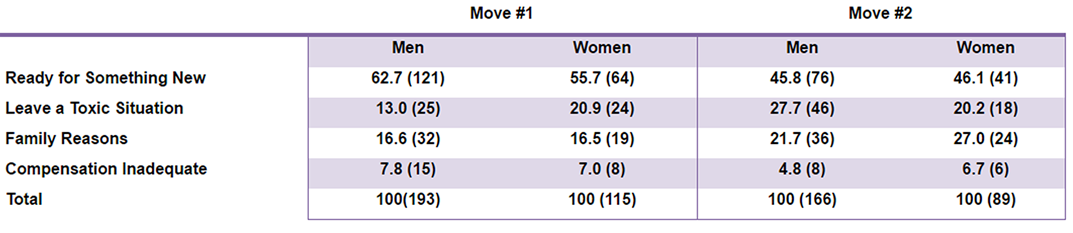
The survey asked respondents to describe their experiences around considerations for moves for each appointment separately, but the comparisons by gender were the same each time. That is, there were no differences in the reasons moves were requested or in how requests for moves were received. The figures regarding why moves were requested appear in Table 15, and despite any apparent differences by gender, none are statistically significant. Those ready for something new were relatively positive about their current placement, but simply ready to move on. Some were bored, or just thought they had done all they could where they were. Those wanting to leave a toxic situation were clearly more negative about the current place. The last two reasons, family and compensation, were more personal and unrelated to the work.
Table 15: Percentage (n)s of Reasons Reported for Requesting a Move
Requests to move were received in the same way, whether from men or from women, so are reported in Table 16 without regard to gender. These numbers were also run by Jurisdiction, which made no difference either. Clearly such requests are mostly well received.
Table 16: Percentage (n)s Reporting the Reception to a Request to Move

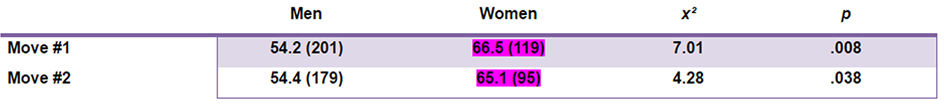
In regard to moves, the only difference was in the initiation of the request. That is, women requested moves more often and at about the same rate in both appointment changes, as seen in Table 17. Recall though that according to Table 15, the reasons for those moves do not appear to differ by gender.
Table 17: Percentage (n)s Reporting a Request to Move
Career Trajectory
There were only three elements in the final questions in which gender made a difference: reasons for turning down potential appointments, reasons for non-election to General Conference, and overall satisfaction with one’s career trajectory. Otherwise, responses were much the same in this section of the survey. Let’s look first at some of the elements where men and women were similar, as depicted in Table 18. The items here about how appointments had worked out for spouses and children are reported as average scores, and are on a scale of 1 (worked out very well) to 4 (did not work out well at all).
Table 18: Percentage (n)s and Averages of Responses Re: Career Trajectory and Appointments for Family
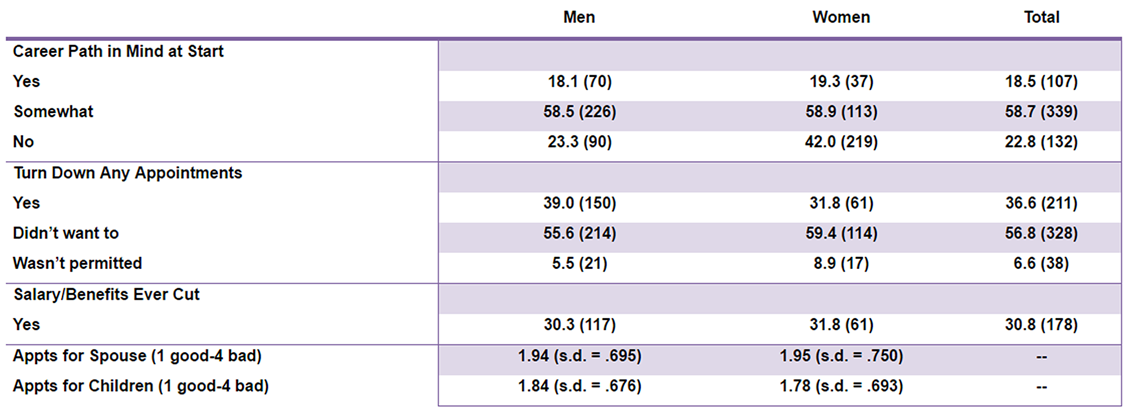
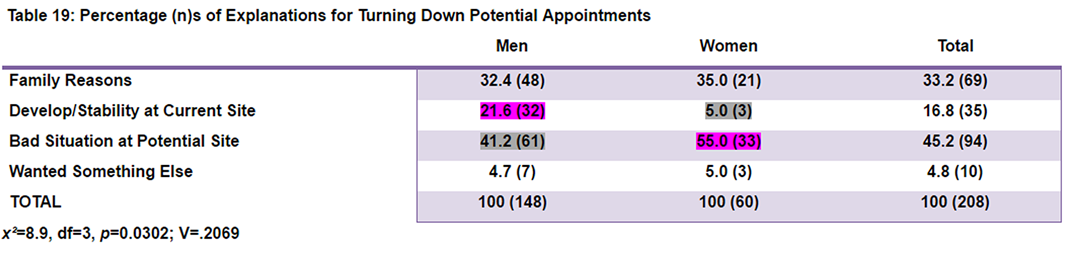
Although there was no difference in the percentages of men and women who had turned down appointments, as seen in Table 18, there were differences in the reasons for such decisions, as shown in Table 19. While those who named family and a desire to pursue something else at the time did not differ by gender, men were much more likely to refer to a desire to continue to develop or pursue stability for a program they started at the current church, where women were more likely to object to something bad about the upcoming potential appointment, such as a struggling church, a undesirable location, or a cut in compensation. This seems to confirm, or perhaps compounds the earlier assertions that men are more likely to be happy (at least at the first appointment) and that they feel appreciated when they DO move because they are more likely to see it as a promotion. Here, when they reject offers to move, it is because of something positive where they are, whereas women are more likely to be trying to avoid a more negative situation.
Table 19: Percentage (n)s of Explanations for Turning Down Potential Appointments
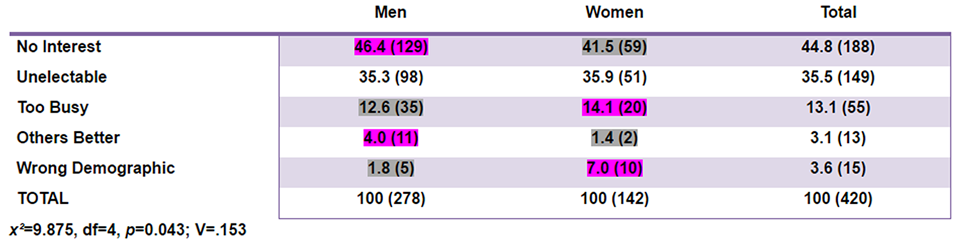
There were also no differences in the percentages of men and women who said they played leadership roles in their Annual Conference and in the General Church. Only 21.5% (124) reported having “run” for General Conference, and of that group, 29% (36) were elected. Those who were not elected or had never run had different reasons to explain why. Women were more likely to say they were too busy or they were from the “wrong” demographic (gender, race, age) while men were more likely to say they were not interested or that others would be better. Both groups were equally likely to say they were “unelectable” which was usually described as not well connected to those with influence or simply not well known. The explanations for non-election appear in Table 20. If those reporting they were “unelectable” are removed from the analysis, and the comparison is made only between the highlighted responses, the correlation between gender and explanation is even stronger (x²=9.89, df=3, p=0.0195; V=.191).
Table 20: Percentage (n)s of Explanations for Non-Election to General Conference
When asked about people who helped and mentored their ministries as well as others who may have hindered it, there were no differences according to gender. The large majority of both men and women said they had been mentored by colleagues and friends, many naming them and others saying there were too many to name. Only 17.6% (102) of respondents said they had had no mentor at all. A smaller majority of 63.7% (337) said there had been people who had hindered their ministry, but the responses did not differ according to gender. Gender also had no relation to the persons who did the hindering – that is cabinet members, other clergy, laity or others (often named but unknown for coding purposes).
Women and men reported similar levels of consideration regarding leaving the ordained ministry and/or leaving the United Methodist Church. These responses had no relation to Jurisdiction either. Because not different by groups, the responses are reported in Table 21 as simple totals.
Table 21: Percentage (n)s Who Reported Consideration of Leaving Ordained Ministry or the UMC

The last important finding is in regard to the differences between men and women looking back, and their general satisfaction with their career trajectories. If average satisfaction scores are compared on a scale of 1 (very satisfied) to 4 (very dissatisfied), men (m = 1.58, s.d. = .746) were more satisfied than women (m = 1.8, s.d. = .843), a difference that is statistically significant (t = -3.200; p = .001). Another way to look at the data is in a cross tabulation of gender by satisfaction level, as seen in Table 22.
Table 22: Percentage (n)s Reporting General Satisfaction with Career Trajectory

If the figures are collapsed into two groups of satisfied and dissatisfied, almost one in five ( 18.9%) women report some level of dissatisfaction, while that is true for only about one in ten (9.3%) men.
Summary
Overall, there are many aspects of the early United Methodist clergy career trajectory that are the same for women and men, but there are also some important distinctions. Some of the most interesting points of difference are as follows:
Demographically:
Women are more likely to be single; men are more likely to be married.
While most clergy have children, it is more common for men than for women.
Ministry as Career:
Men are more likely to pursue ministry as a first career; women as a second career.
Men rank their first three appointments as “better” than women do, and men are happier in the very first appointment than women.
`Itinerancy:
Women request appointment changes more than men. When men and women turn down potential appointments, it is for different reasons, with men more focused on staying where things are going well, and women focused on avoiding a move to a place that doesn’t look as attractive.
Overall Satisfaction:
While the majority of all clergy are satisfied with their career trajectories, male clergy are more satisfied than women.
There are some important limits to this study which warrant mention. One is that this survey was distributed to current clergy. Those most frustrated with their careers may have already left the ministry, so they were not accessible. In other words, these may be among the most satisfied of the clergy since they are still engaged in the work. That said, it may be that the larger proportion of women who answered this survey, in relation to the percentage of all clergy who are women, are among the least contented. That is, they may have seen this as a way to express their concerns, particularly their concerns AS women. Still, the majority of women (and men) in the sample are quite satisfied overall, so the differences are somewhat nuanced. That is, this is not simple data from happy men and unhappy women. These data are from mostly happy clergy who have some, and not many, differences according to gender. Hence, those few differences stand out, and warrant further investigation.