by Amanda Mountain & Rev. Leigh Goodrich
A total of 864 delegates will meet from May 10-20th in Portland, Oregon to revise church laws, adopt new ones, and approve plans and budgets for church-wide programs. Half of the delegates are laity and half are clergy, and the number of delegates representing each jurisdiction and each annual conference is proportional to the jurisdiction and annual conference’s membership. Women by the Numbers takes a closer look at who will be at this decision-making table in May. This month, we provide a snapshot of women delegate representation by annual conferences within the United States
A total of 864 delegates will meet from May 10-20th in Portland, Oregon to revise church laws, adopt new ones, and approve plans and budgets for church-wide programs. Half of the delegates are laity and half are clergy, and the number of delegates representing each jurisdiction and each annual conference is proportional to the jurisdiction and annual conference’s membership. Women by the Numbers takes a closer look at who will be at this decision-making table in May. This month, we provide a snapshot of women delegate representation by annual conferences within the United States.
As a review, 44% of the delegates from the United States are female, 56% are male. In addition, 36% of clergy delegates are clergywomen and 64% are clergymen, while 52% of lay delegates are women and 48% are men. The United Methodist Church in the US is divided into 5 regional areas called jurisdictions, and then into Annual Conferences within each jurisdiction. The addendum included with this article shows the breakdown of delegates by annual conference.
Summary of Annual Conferences
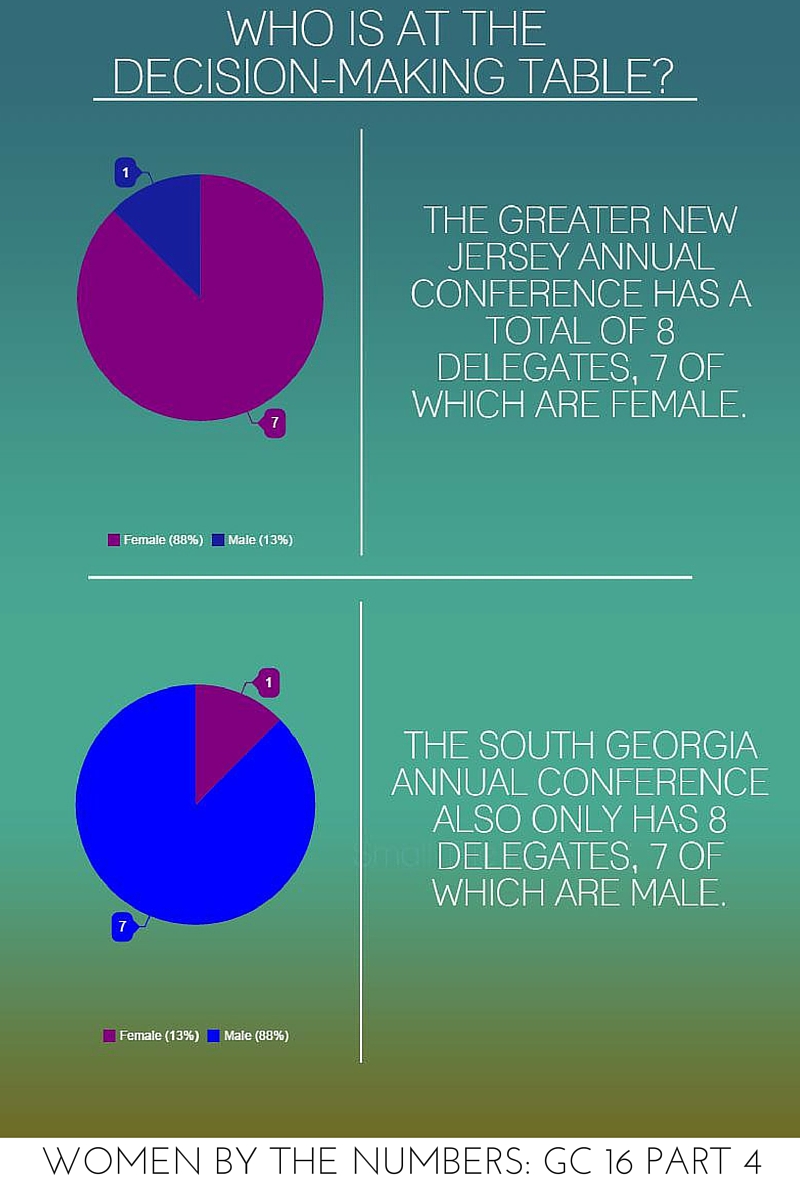
nor the Dakotas Annual Conferences elected any male delegates. Notably, all of these delegations except Northwest Texas only elect two delegates each. Red Bird Missionary Conference, South Georgia, Memphis, New Mexico, Northwest Texas, Wisconsin, and the Oklahoma Indian Missionary conference did not elect any female clergy delegates to General Conference, while Peninsula-Delaware annual conference elected no female lay delegates.
In addition to Alaska and the Dakotas with 100% female delegates, other annual conferences with high percentages of female delegates are Greater New Jersey (88% female delegation) and Minnesota (75% female). The annual conferences with the lowest percentage of female delegates are those cited above with no women in their delegation, followed by South Georgia at 12% female, Texas at 16% female, and West Ohio with a delegation that is 33% female.
Lay Membership Compared to Lay Delegates
Three of the top 5 largest annual conferences hold a disproportionate amount of female delegates to female lay members. For example, women account for 57% of all lay members in the North Georgia Annual Conference but only 30% of their lay delegation. The Texas annual conference is similar with women accounting for 57% of lay members but only 22% of the lay delegation, and in Florida women account for 60% of all lay members but are less represented at only 56% of the lay delegation.
Women in two of the largest annual conferences are proportionately represented. Virginia’s lay membership is 57% female and their lay delegation is 64% women, and in Western North Carolina, women account for 56% of all annual conference lay members and 70% of their lay delegation.
Summary
Female delegates from annual conferences in the United States tend to be more representative of lay and clergy membership with a few exceptions. When looking at the top 5 annual conferences by membership, and thus the largest US delegations, all of these delegations come from the South Central and Southeastern Jurisdictions in the United States, and the delegations from these annual conferences are not always proportionate to the annual conference female lay and/or clergy membership. We should ask ourselves if this is important. Do women want to be proportionately represented? Do women want to challenge the church for a more equal representation at the table with a more even 50/50 split between the genders? Is proportional representation the best women can and should strive to do? What would our delegations look like in a world which promoted “a continuing commitment to the full and equal responsibility and participation of women in the total life and mission of the Church, sharing fully in the power and in the policy-making at all levels of the Church’s life.”
*In our recent Women by the Numbers, we misreported that there was only 1 delegate from Alaska and 3 from Pacific North West. This was based on information we received which was incorrect. Rather than make assumptions about the error, we reported the information as it was reported to us for the benefit of those reading the article. We apologize for any inconvenience or misrepresentation this caused.
See more Women by the Numbers, including all of the Who Is At the Decision-Making Table? series, on our Women by the Numbers archives.