by Amanda Mountain & Rev. Leigh Goodrich
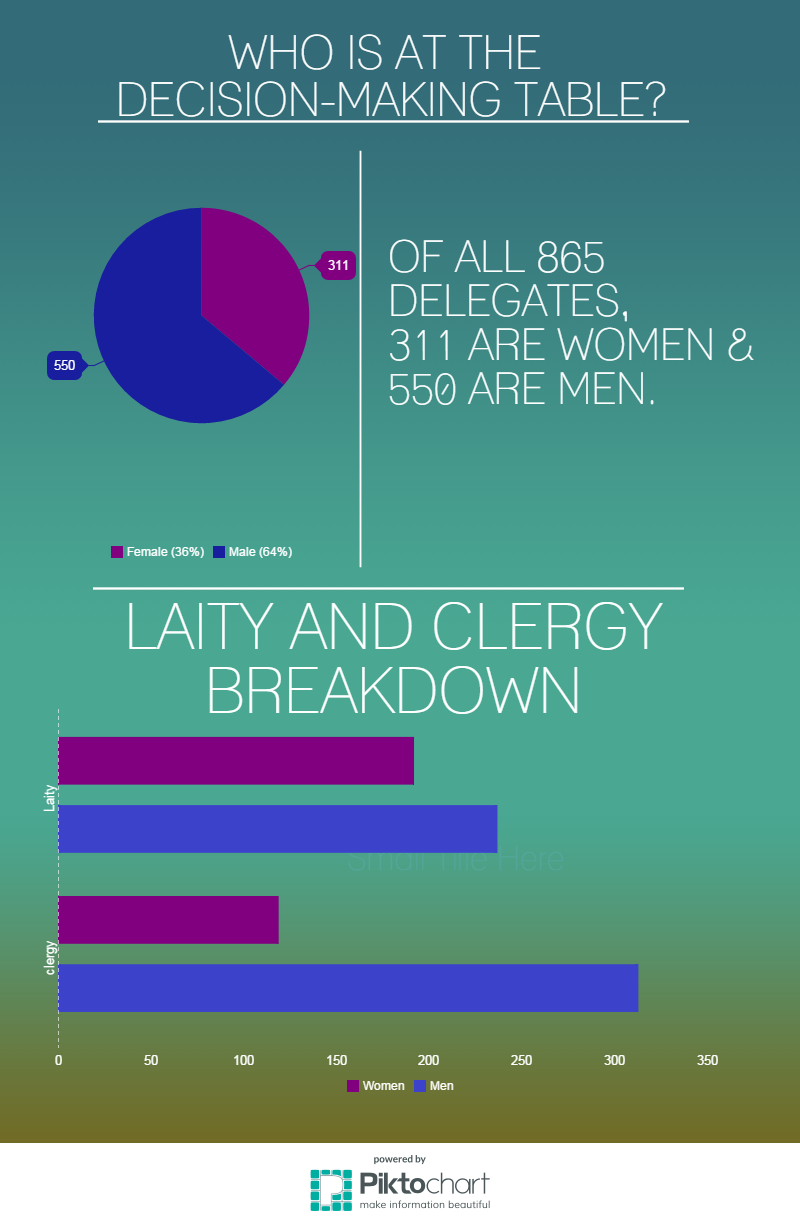
A total of 865 delegates were elected to the 2016 General Conference, the top policy-making body of The United Methodist Church. This group of 505 US Delegates and 360 Central Conference delegates will meet from May 10-20th in Portland, Oregon to revise or adopt church laws and approve plans and budgets for church-wide programs. It is legislated by the 2008 Book of Discipline that half of the delegates be laity and half clergy, and that the number of delegates representing each jurisdiction and each annual conference be proportional to the jurisdiction and annual conference’s membership. For the next three months, Women by the Numbers will be taking a closer look at who will be at this decision-making table in May, especially regarding the representation of women at General Conference. This month we will provide a general overview of the delegates based on US and Central Conference membership, notably, the numbers of lay and clergy delegates and the numbers of male and female clergy and lay delegates.
Highlights:
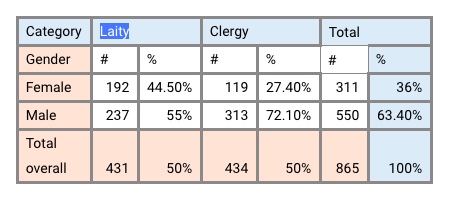
- Of the 865 delegates elected to the 2016 General Conference, 550 (63.5%) are male and 311 (36%) are female
- Of the 431 lay delegates, 192 (44.5%) are female and 237 (55%) are male
- Of the 434 clergy delegates, 119 (27.4%) are female and 313 (72%) are male
- Of the 311 female delegates, 192 (61%) are laity and 119 (38%) are clergy
- Of the 550 male delegates, 237 (43%) are laity and 313 (57%) are clergy
- The largest group represented are male clergy at 313 delegates (36% of all delegates and 72% of all clergy delegates)
- The smallest group represented are female clergy at 119 (13%) of all delegates and 27.4% of all clergy delegates
Lay Women:
- Of the 431 laity elected as delegates to General Conference 2016, 192 (or 44.5%) are female and 237 (55%) are male
- Of all 865 delegates, 22% (192) are lay women
Clergywomen:
- Of the 434 Clergy elected as delegates to General Conference 2016, 119 (or 27.4%) are female and 313 (72.1%) are male
- Of all 865 delegates, 13.7% (119) are clergywomen
Compared to 2012 numbers:[1]
Of the 1,017 delegates elected to the 2012 General Conference, 63% were male and 37% were female, meaning the number of female delegates drops by 1% in 2016. Overall the number of female delegates elected to 2016 as compared to 2012, has stayed roughly the same
In addition, of the 1,017 delegates elected to General Conference in 2012, 146 (or 14%) were clergywomen compared to the overall 13.7% in 2016. Not much has changed it seems for clergywomen representation at General Conference. Lay women also stayed almost the same with 231 (22%) of the 1,017 delegates elected in 2012 being lay women compared to the same 22% of all delegates in 2016.
Why the stagnancy in these numbers? We invite you to submit your thoughts below.
Highlights of Central Conference Delegates by Region:
The number of female clergy elected as delegates to General Conference is very low in each region. Where are our Central Conference clergywomen delegates? Are there just not that many clergywomen in the Central Conferences or are Central Conference clergywomen just not elected as delegates to General Conference?
Coming up:
In the next Women by the Numbers, we take an in-depth look at the US delegates, breaking the numbers down by clergy/lay status, conference, and membership. And stay tuned in the coming weeks for more statistics leading up to General Conference in Portland this May.
[1] See the Women by the Numbers archives for 2012 General Conference delegate figures available at: http://www.gcsrw.org/ResearchMonitoring/WomenbytheNumbers/Archive.aspx