Introduction
A total of 602 U.S. delegates were elected to the 2012 General Conference of The United Methodist Church. As legislated by 2008 The Book of Discipline, half of the delegates are laity and half are clergy. Furthermore, the number of delegates representing each jurisdiction and each annual conference is proportional to the jurisdiction and annual conference’s membership (See Table 1 and Table 2). The Southeastern Jurisdiction has the most delegates with 220 and the Western Jurisdiction the least with 32.
Highlights
- 44% of the U.S. delegates are female
- 149 laywomen (50% of laity) and 117 clergywomen (39% of clergy) delegates
- 58 of the 59 annual conferences delegations have at least one female delegate
- 22% of the U.S. delegates are people of color
- 45 clergymen of color (15% of clergy ); 29 clergywomen of color (1% of clergy)
- 34 laymen of color (1% of laity); and 27 laywomen (1% of laity) delegates
- 14 annual conference delegations do not include any people of color
Gender
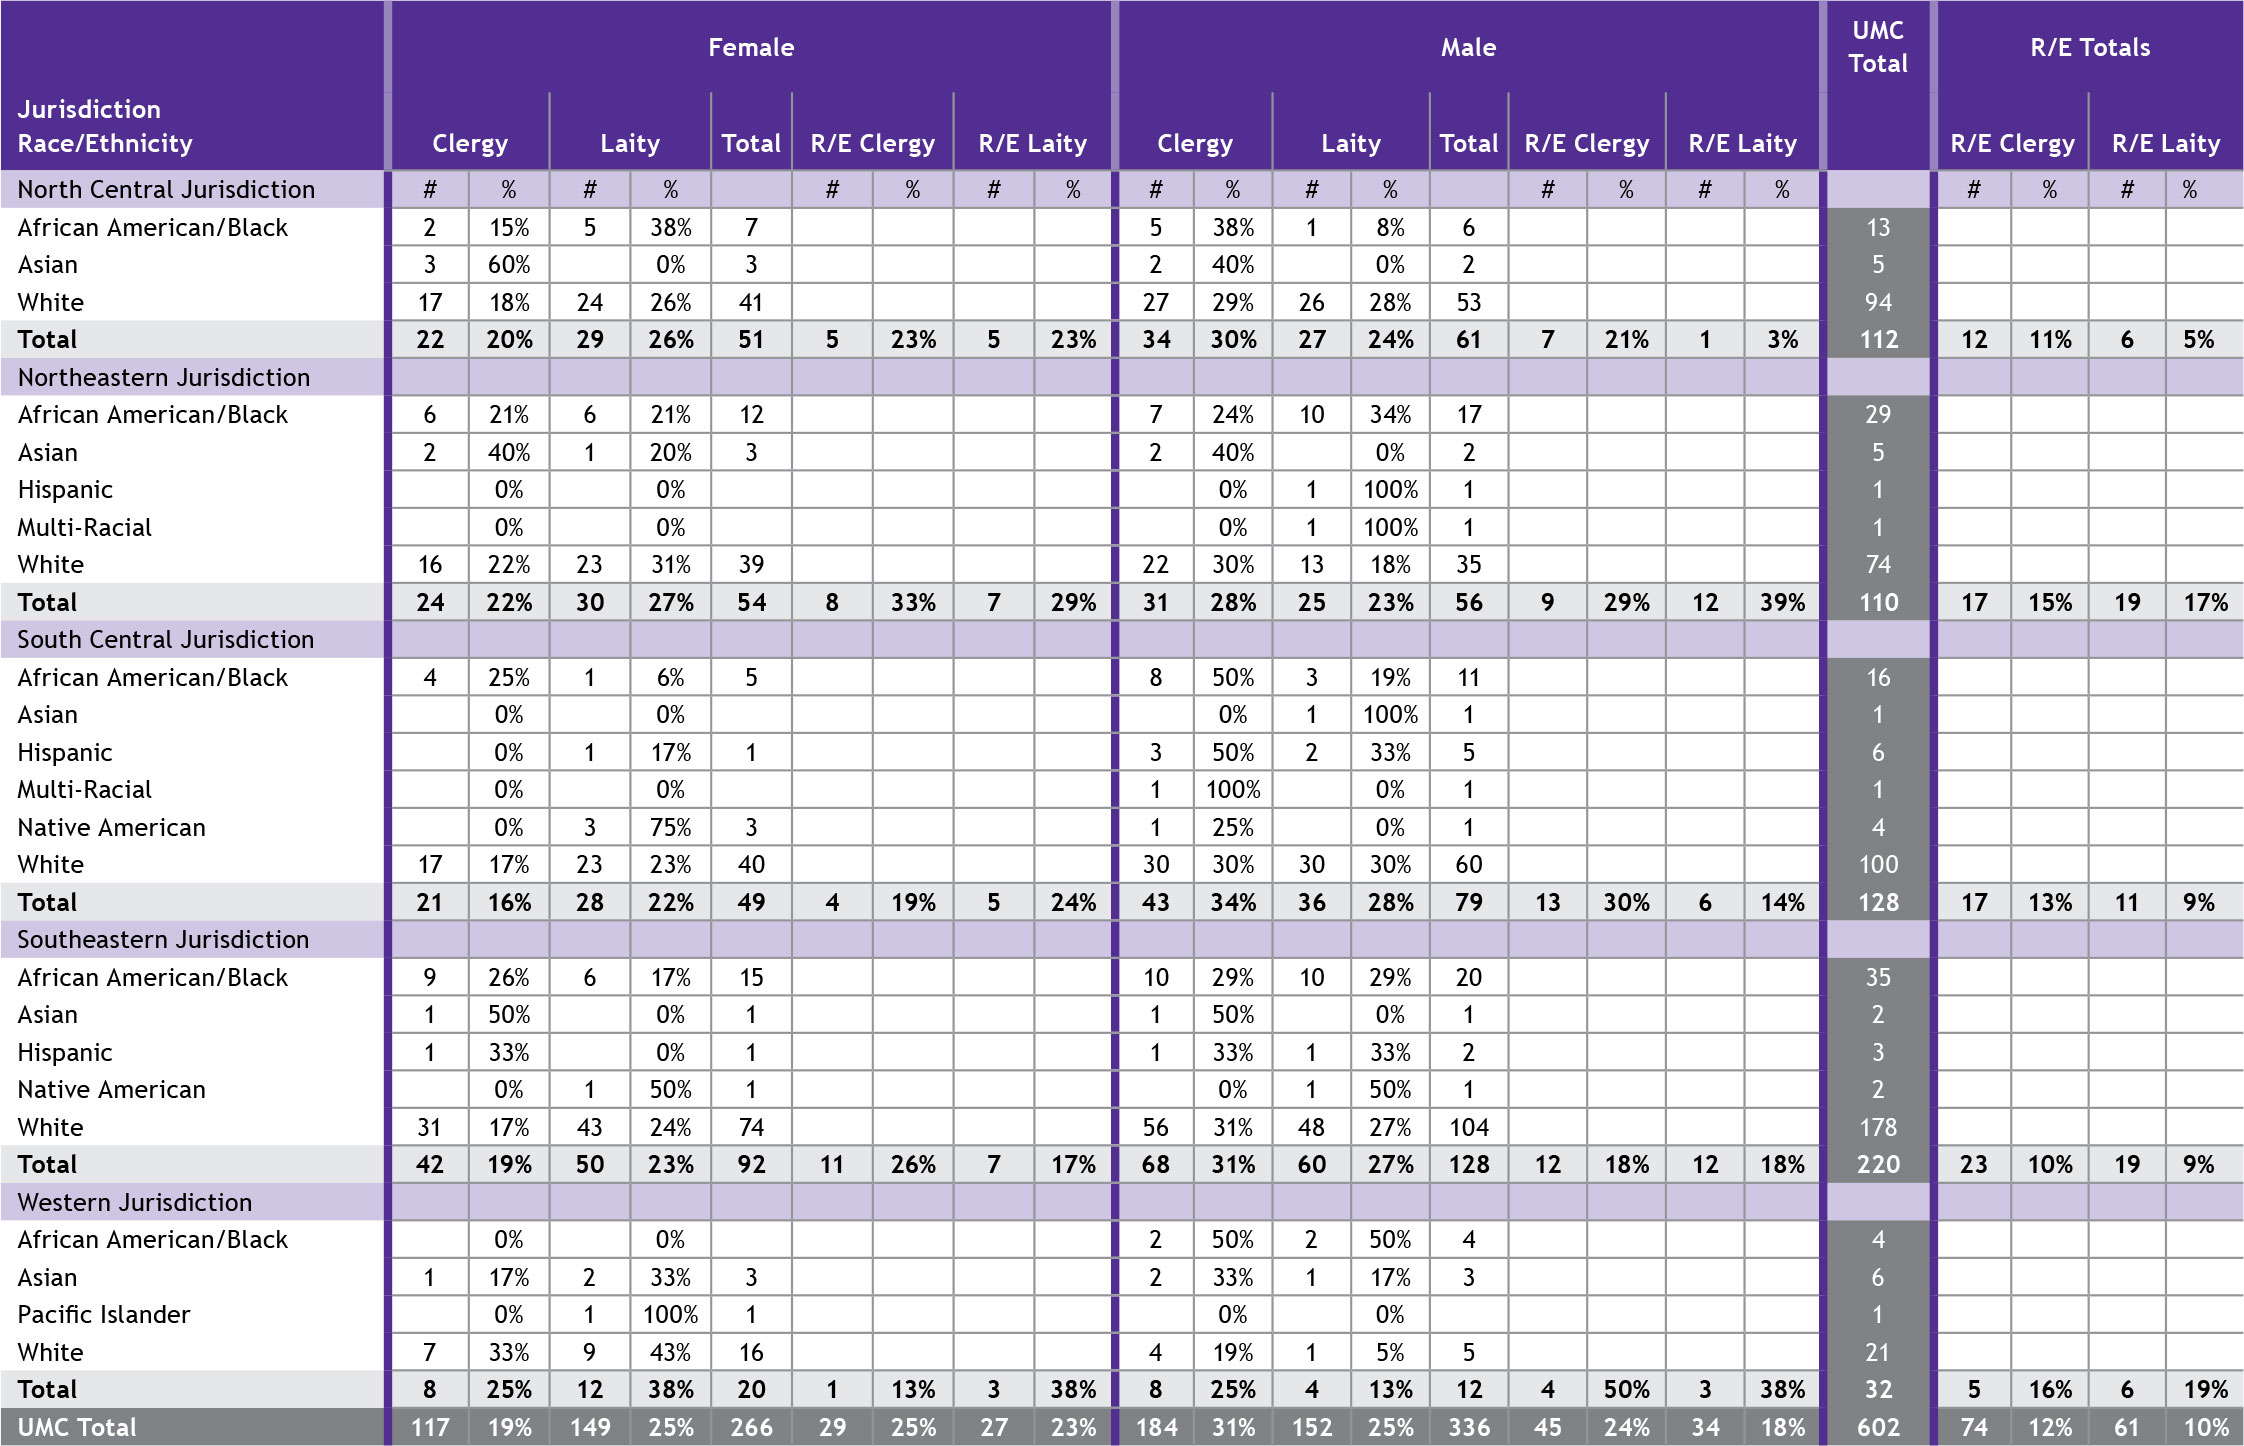
Forty-four percent or 266 of the delegates are women and 56% (or 336) are men. One jurisdiction, Western, has more female delegates than male (see Table 2). When aggregated by gender and status (lay or clergy), the largest percentage of U.S. delegates are clergymen at 31% and smallest percentage is clergywomen at 19% (see Table 3). The laity is almost evenly divided between men (152) and women (149).
Thirty-two of the 59 annual conference delegations (54%) have a percentage of their female representation equal to or greater than 44%, which is the overall percentage of U.S. female delegates (see Table 4). All but one annual conference delegation has some representation of women with the lowest percentage being 25%.
Table 1
Delegate Status by Annual Conference and Jurisdiction
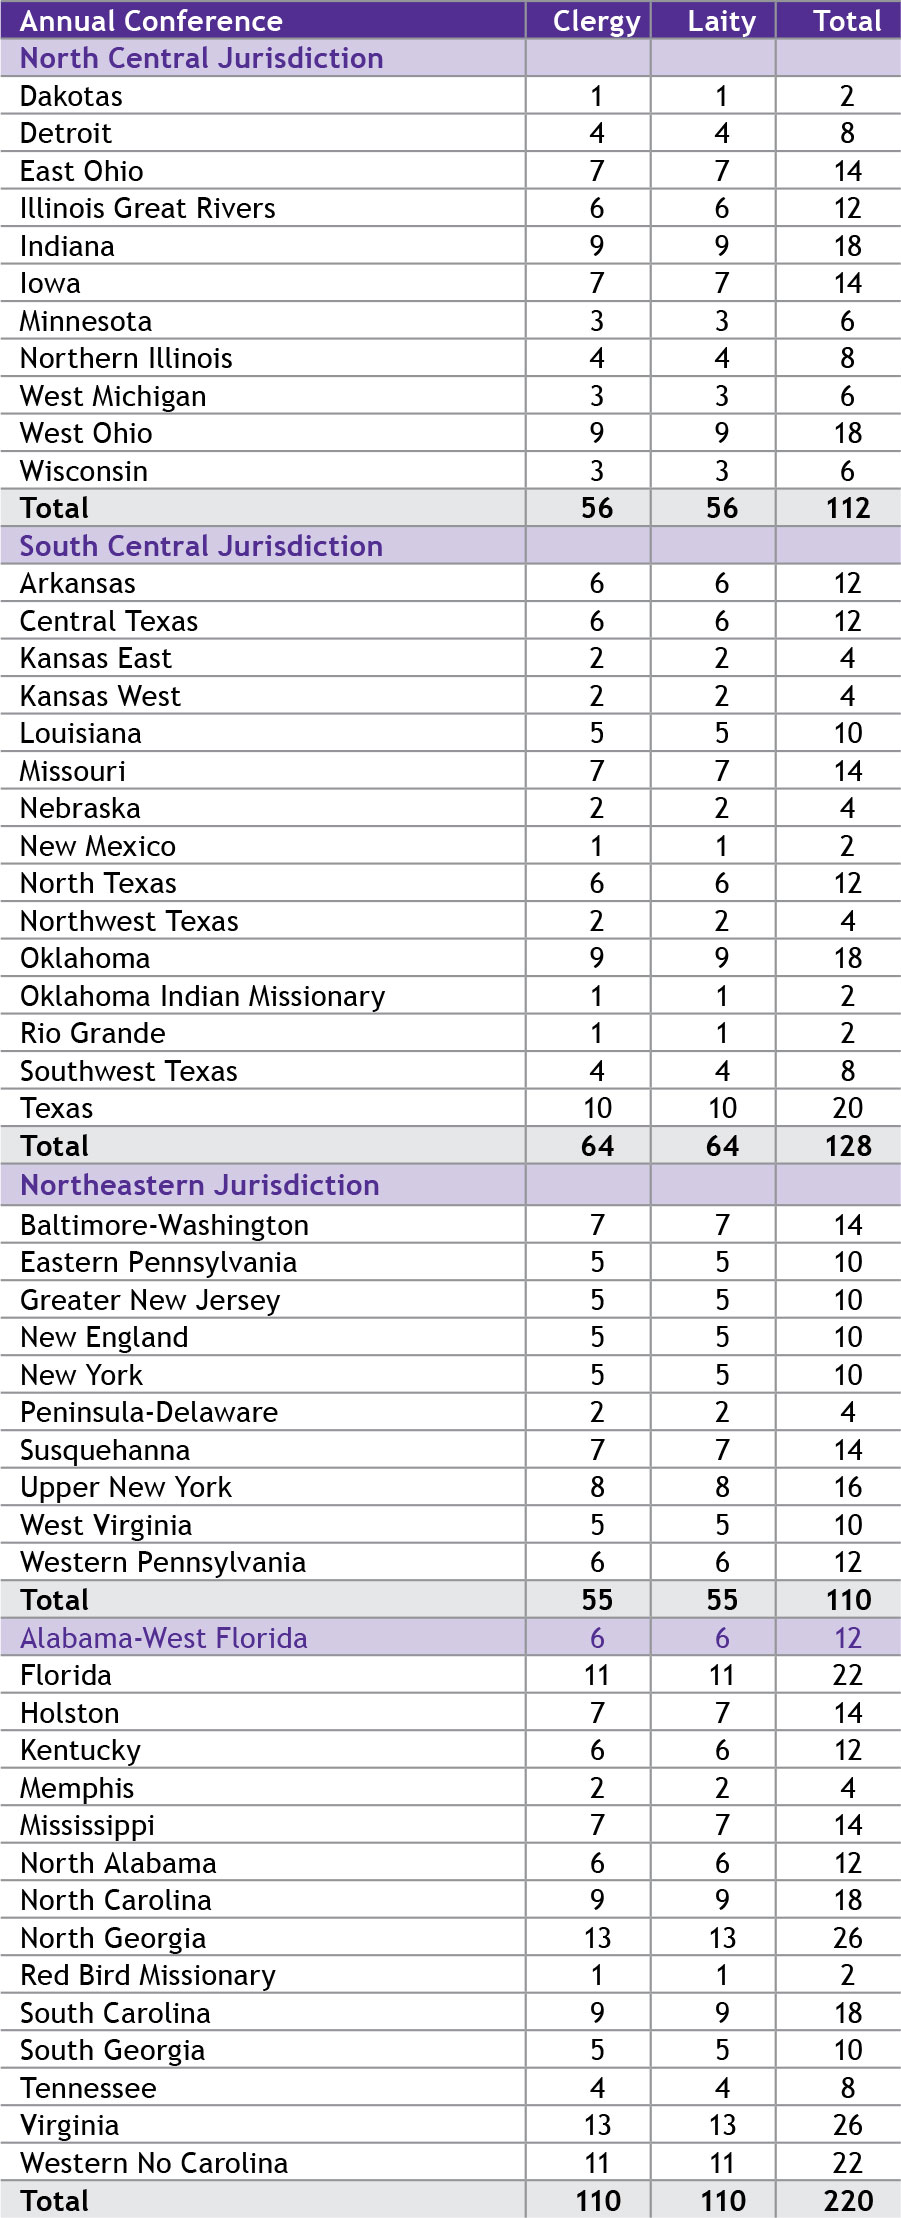
Table 2
Delegate Gender by Jurisdiction
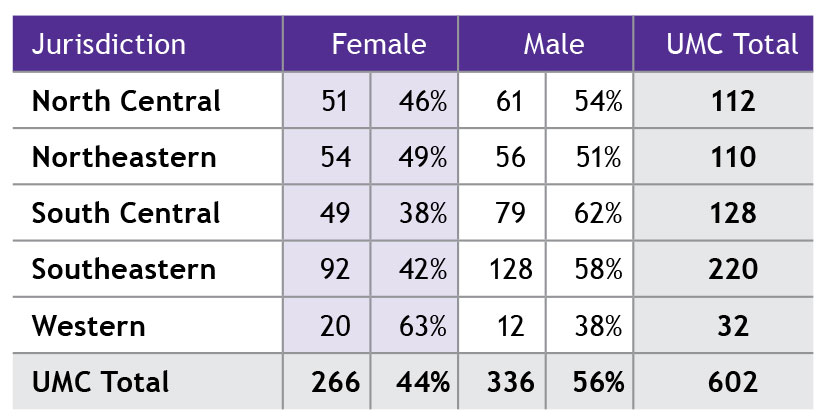
Table 3
Delegate Status and Gender by Jurisdiction
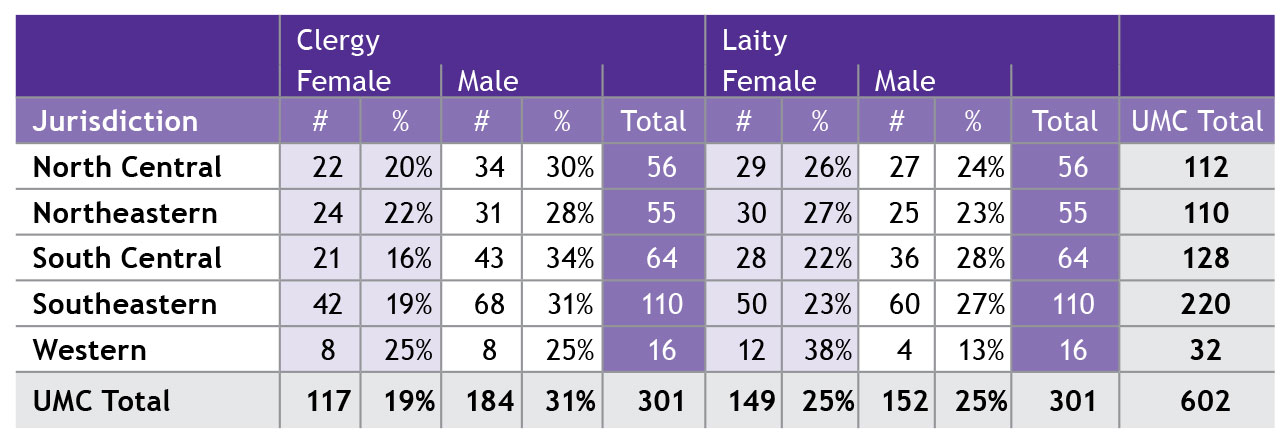
Table 4
Delegates’ Gender by Annual Conference (Ranked)
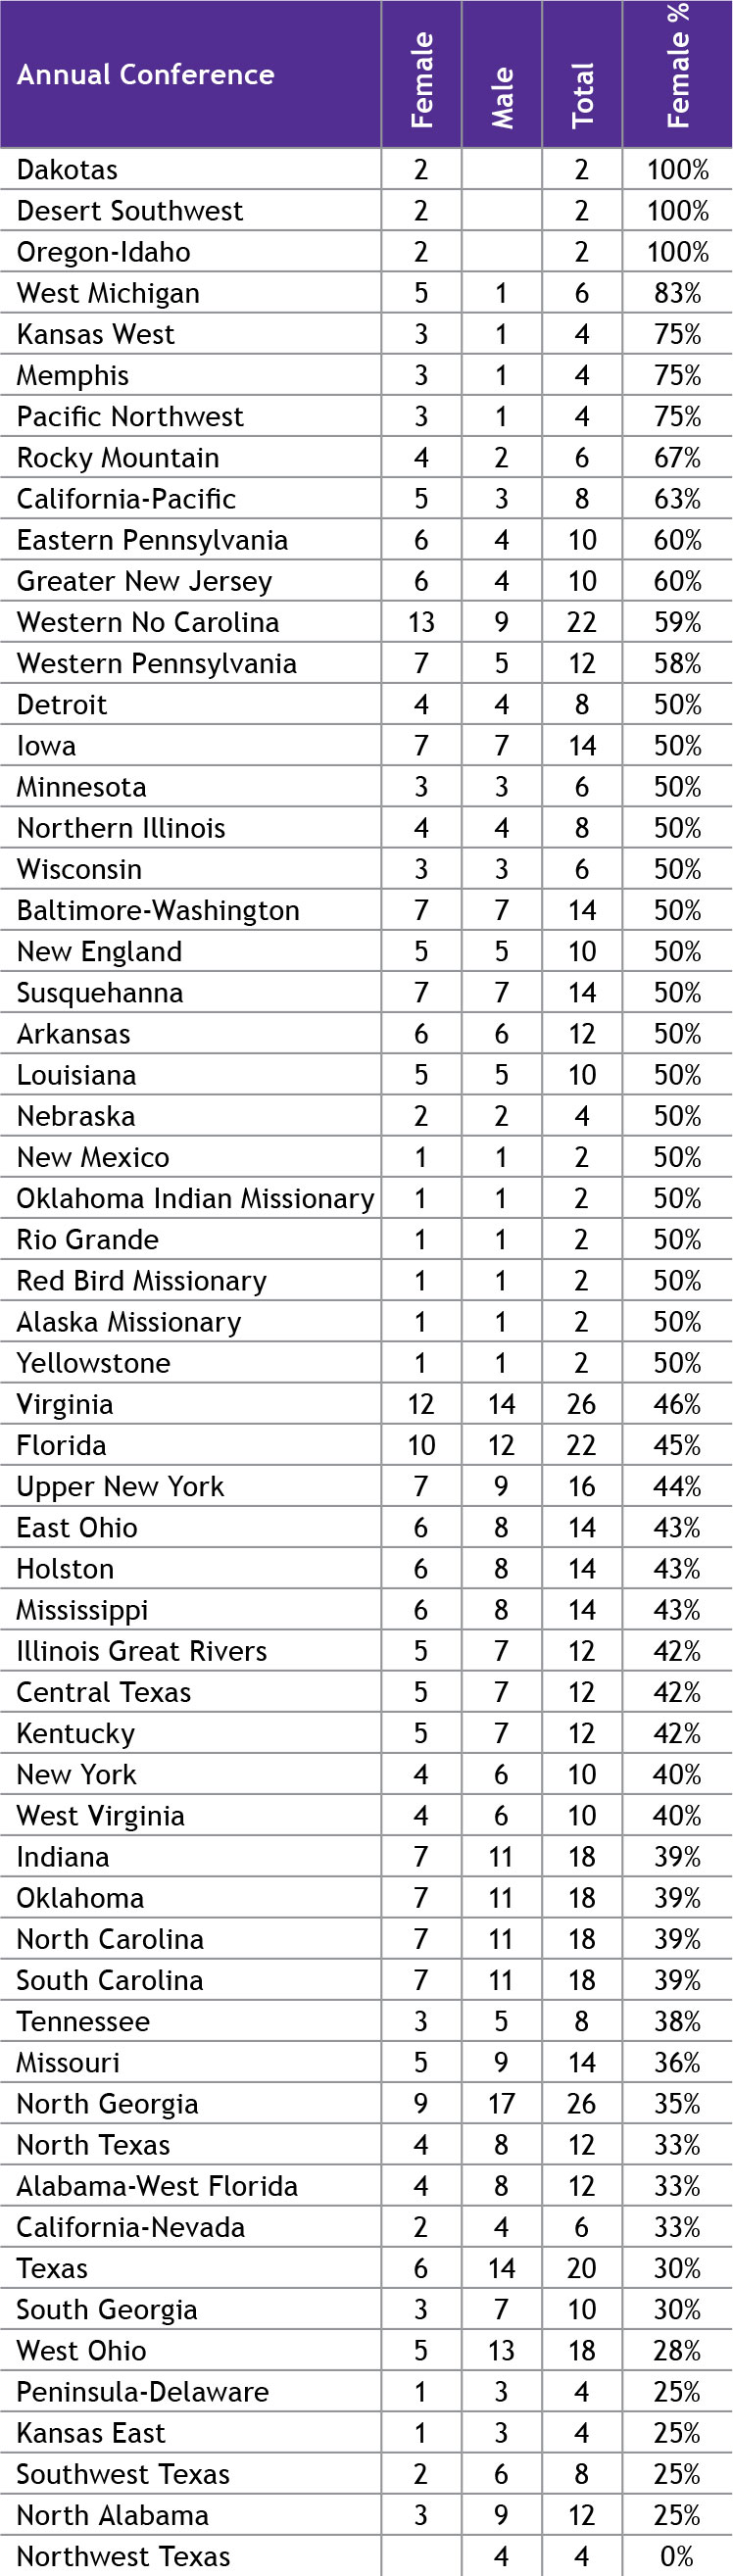
Table 5
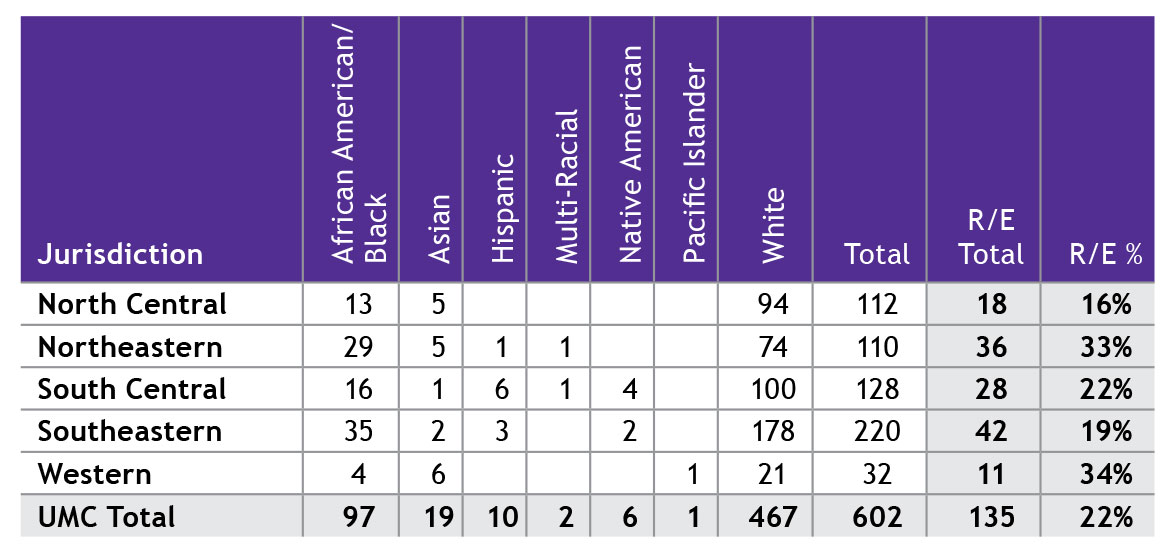
Delegates’ Race/Ethncity by Jurisdiction
People of Color
One in five U.S. delegates or 135 (22%) is a person of color (see Table 5). The largest percentage of people of color is African Americans/Black with 97 delegates (or 71%) of the people of color representation. In two jurisdictions—Northeastern and Western— a third of their delegation are people of color. However, 14 (or 22%) of the annual conference delegations report 0% people of color (see Table 6). While it might be argued that the delegations without people of color are too small for diversity, there are other annual conferences as small or smaller that achieved diversity.
Women of color have a greater percentage of the overall female representation than the men of color have of the overall male representation (see Table 7). However, in terms of numbers, the men of color (79) outnumber the women of color (56).
To put things in perspective, there are 257 white males to the 135 males of color, which is almost a 2 to 1 ratio. Further, there are 13 legislative committees, if the jurisdictional delegates were divided evenly among the committees, on each committee there would be 4 women of color, 6 men of color and 35 white persons. The strength of the 3 to 1 ratio of whites to people of color in the overall U.S. delegation is clearly viewed here, demonstrating the diminished representation of people of color in the committees.
Table 6
Delegates’ Race/Ethnicity by Annual Conference (Ranked)
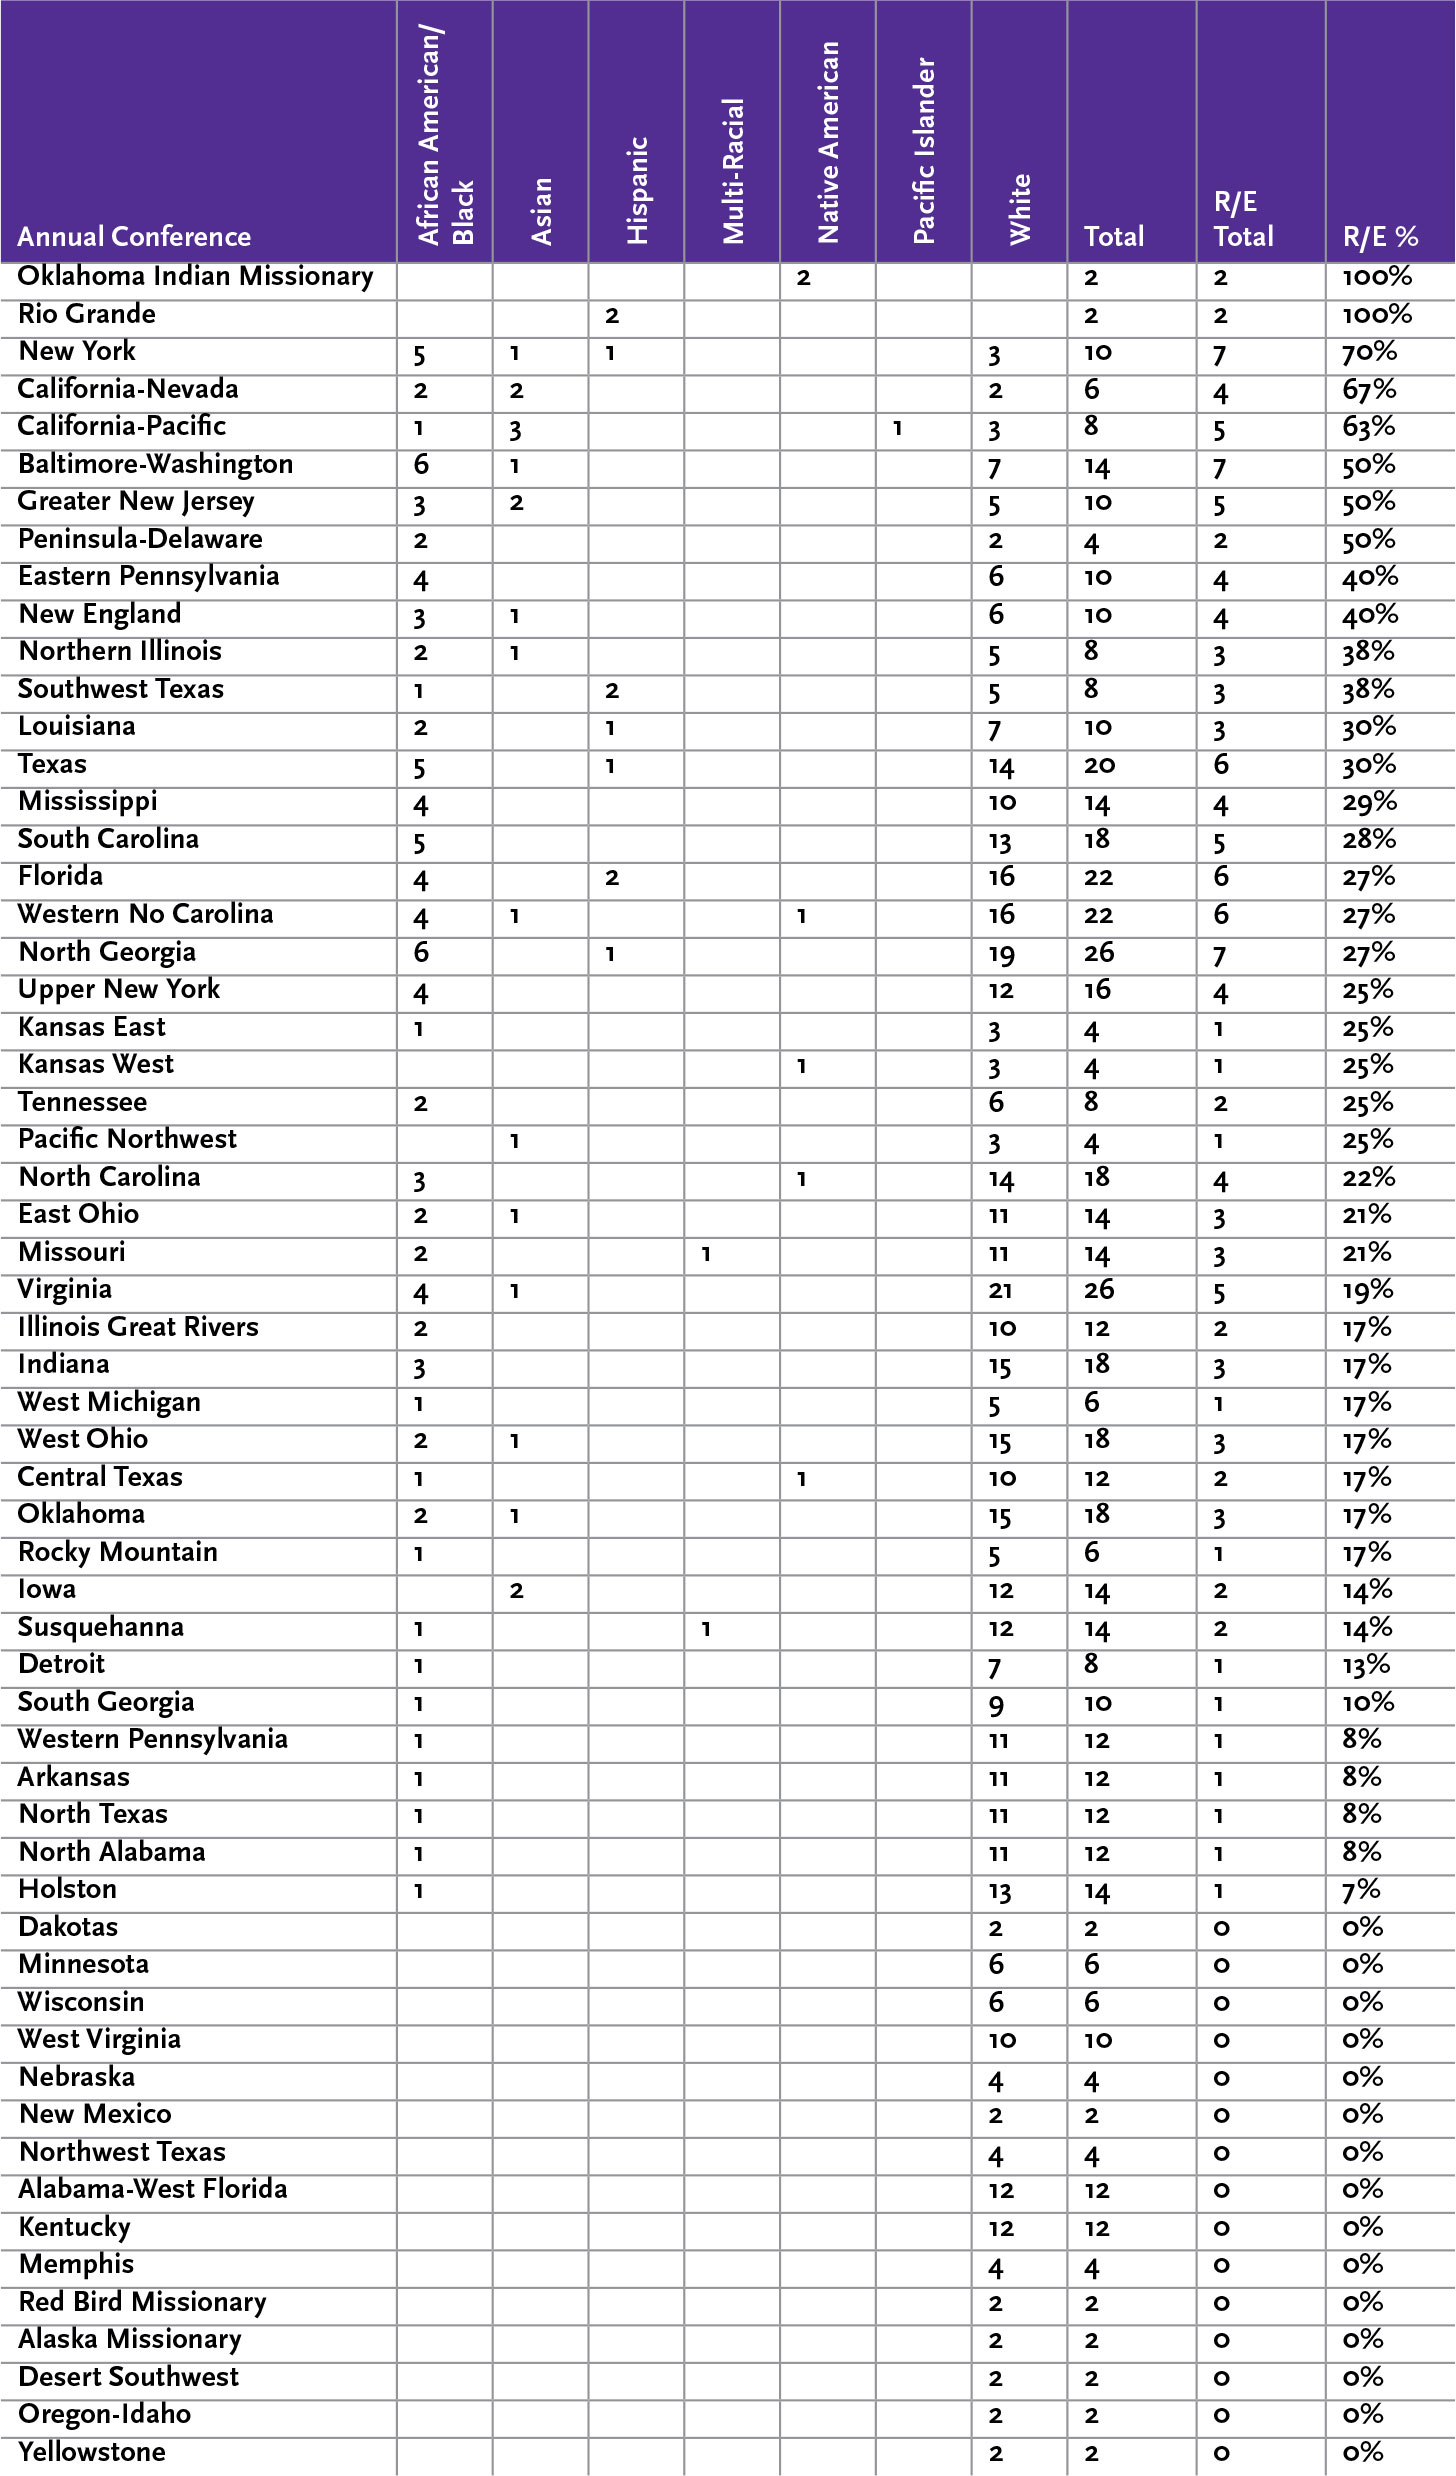
Table 7
Gender and Status by Race/Ethnicity and Jurisdiction
Conclusion
The General Conference of The United Methodist Church represents the “highest level of decision making in the church.” Over the two-week period that it meets in 2012, it will approve not only a budget but more importantly the mission and ministry of The United Methodist Church for the next four years. This summary provides but a snapshot of who is at the table to make those decisions. The question though is whom do these decision-makers represent? And what mission and ministry will they approve? Do they represent the demographic membership of The United Methodist Church that exists today or do they represent the church that God is calling all Christians to be? Will it be a mission and ministry of the status quo or a mission and ministry of “making disciples for Jesus Christ?”