By Craig This
Fifty-seven persons (57) were elected chairs of U.S. annual conference delegations to the 2012 General Conference of The United Methodist Church, according to delegate data supplied by General Conference.
Leading a delegation is considered an honor, which some conferences reserve for one person (often alternating between a clergyperson and layperson every four years). Others, name a layperson and a clergyperson as coheads.
While these methods for selecting leaders do limit the analysis of the chairs based upon status (clergy/lay), the data do provide opportunities to analyze the chairs based upon other demographic data to see who becomes chosen and who does not by annual conferences.
Leadership by Status
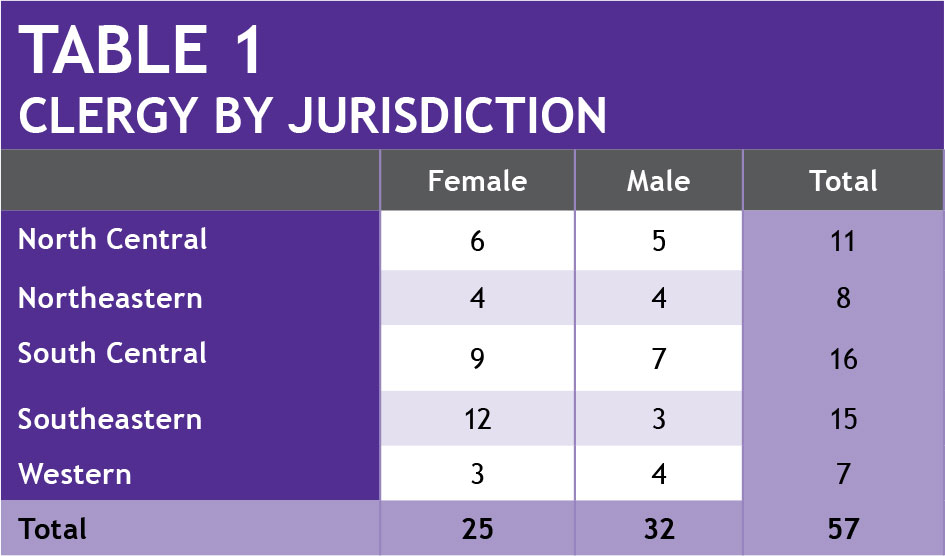
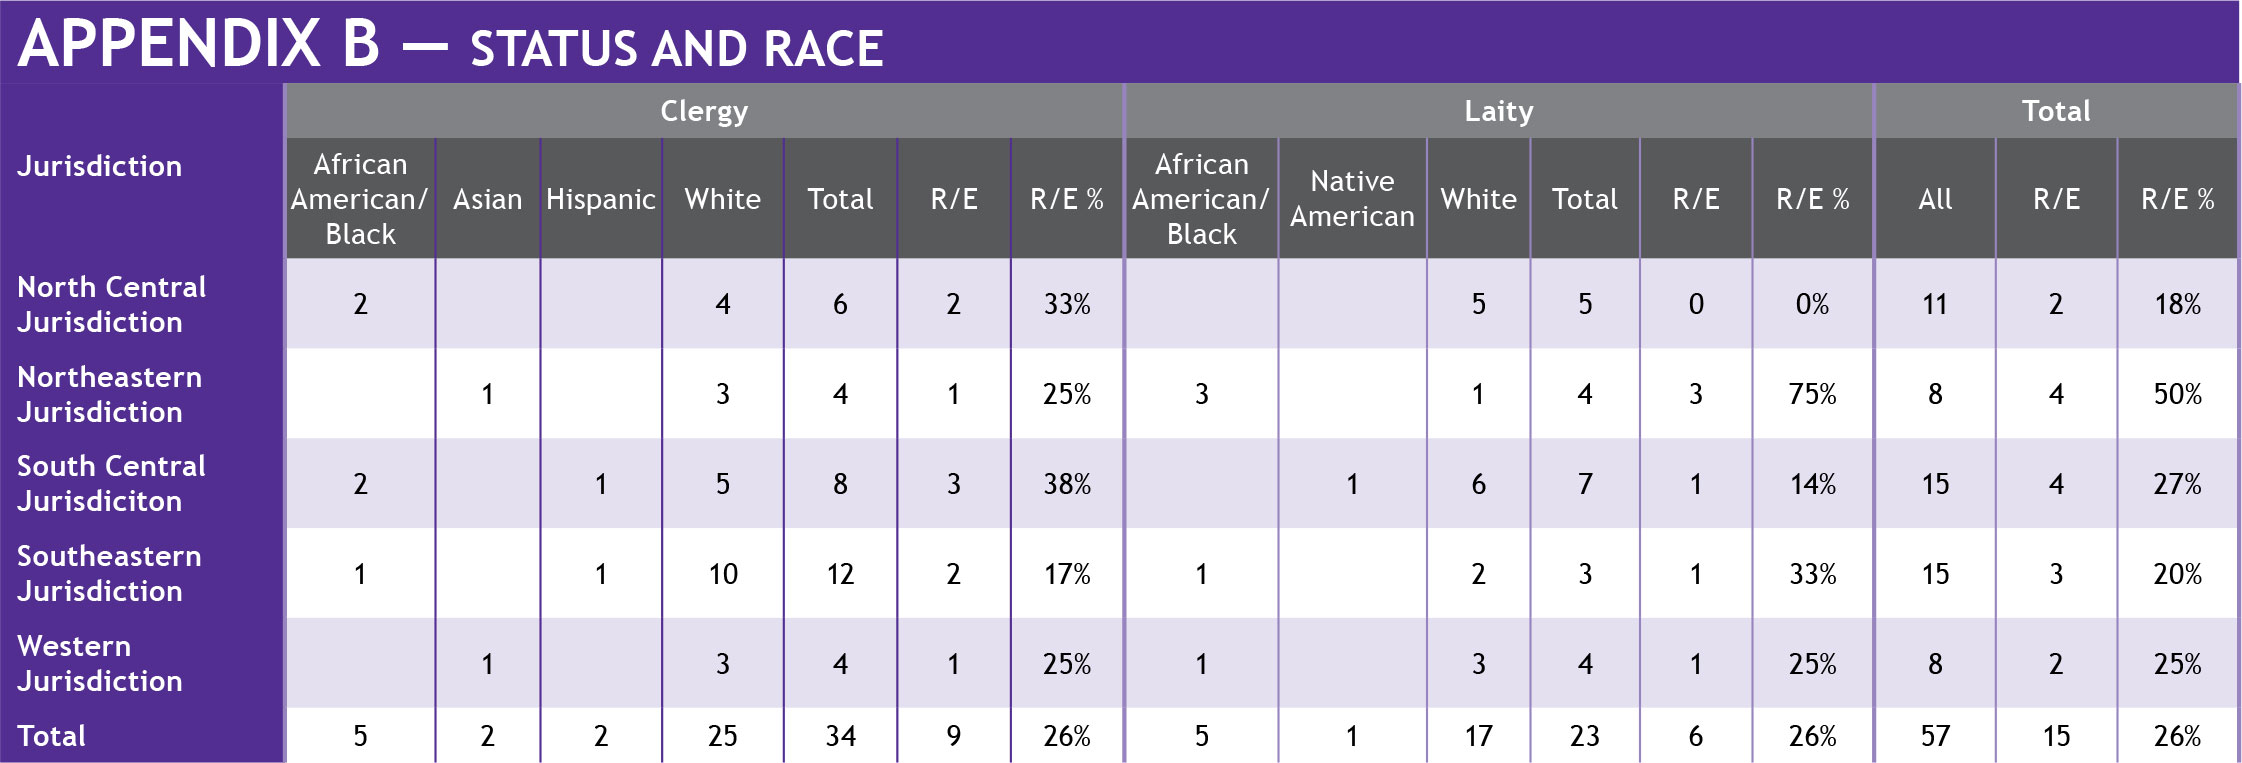
Clergy still outnumber laity 34 to 23 as chairs of delegations to the 2012 General Conference (see Table 1). Only the Western Jurisdiction has more laity than clergy chairs; the Northeastern Jurisdiction is evenly divided between laity and clergy.
Gender
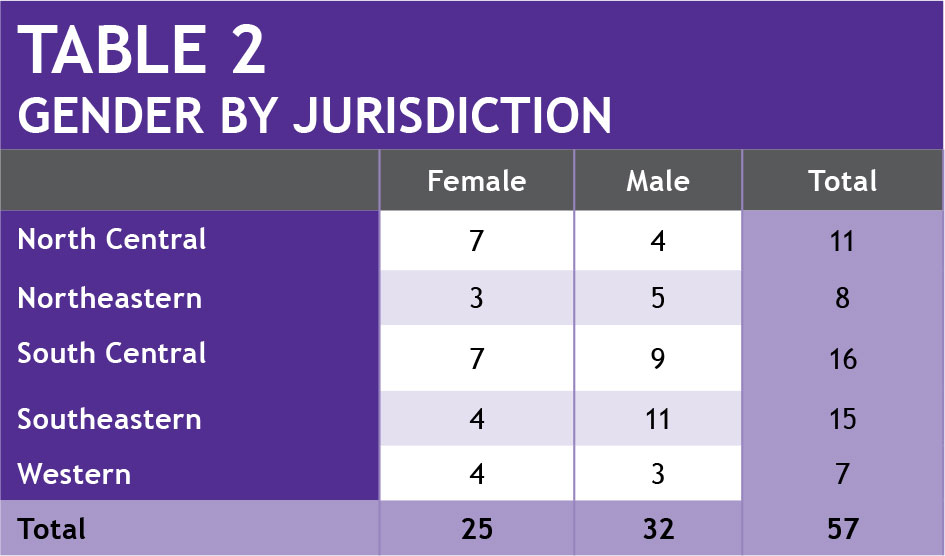
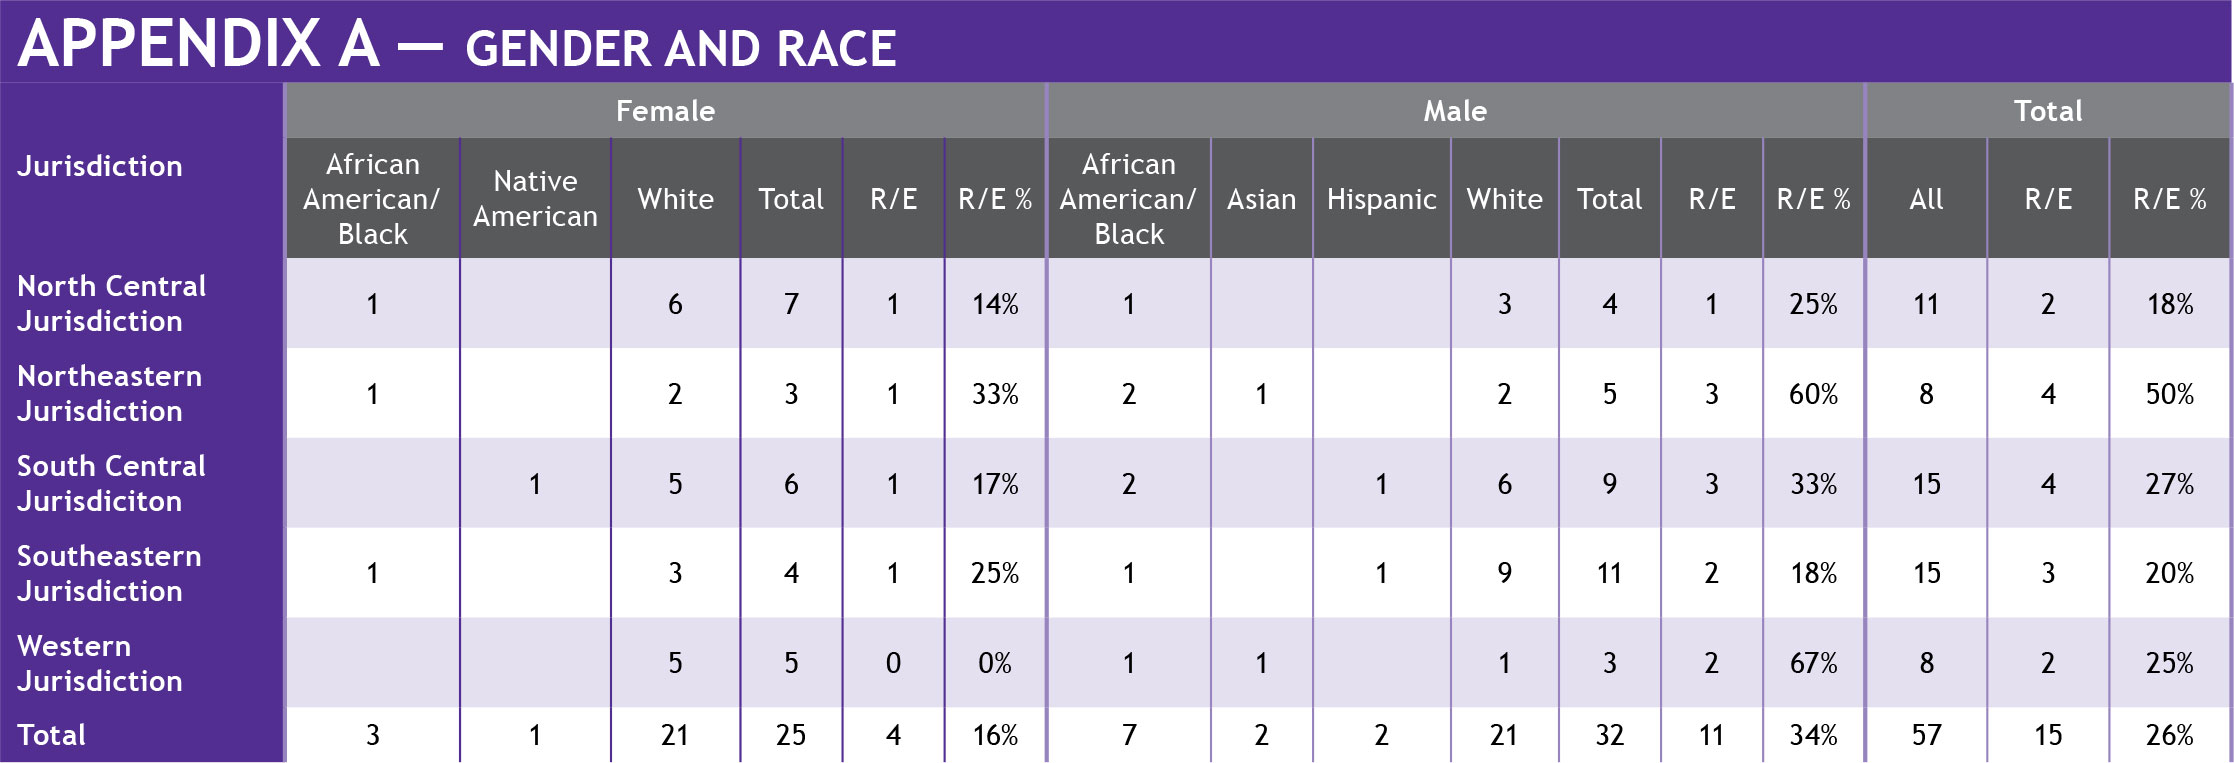
Of the 57 U.S. chairs, 32 are male (56%) and the 25 are female (44%). Coincidentally, the male-female percentage of chairs is exactly the same as the overall U.S. jurisdictional representation of males and females to the 2012 General Conference. Two of the five jurisdictions—North Central and Western—have more female chairs than male chairs (see Table 2).
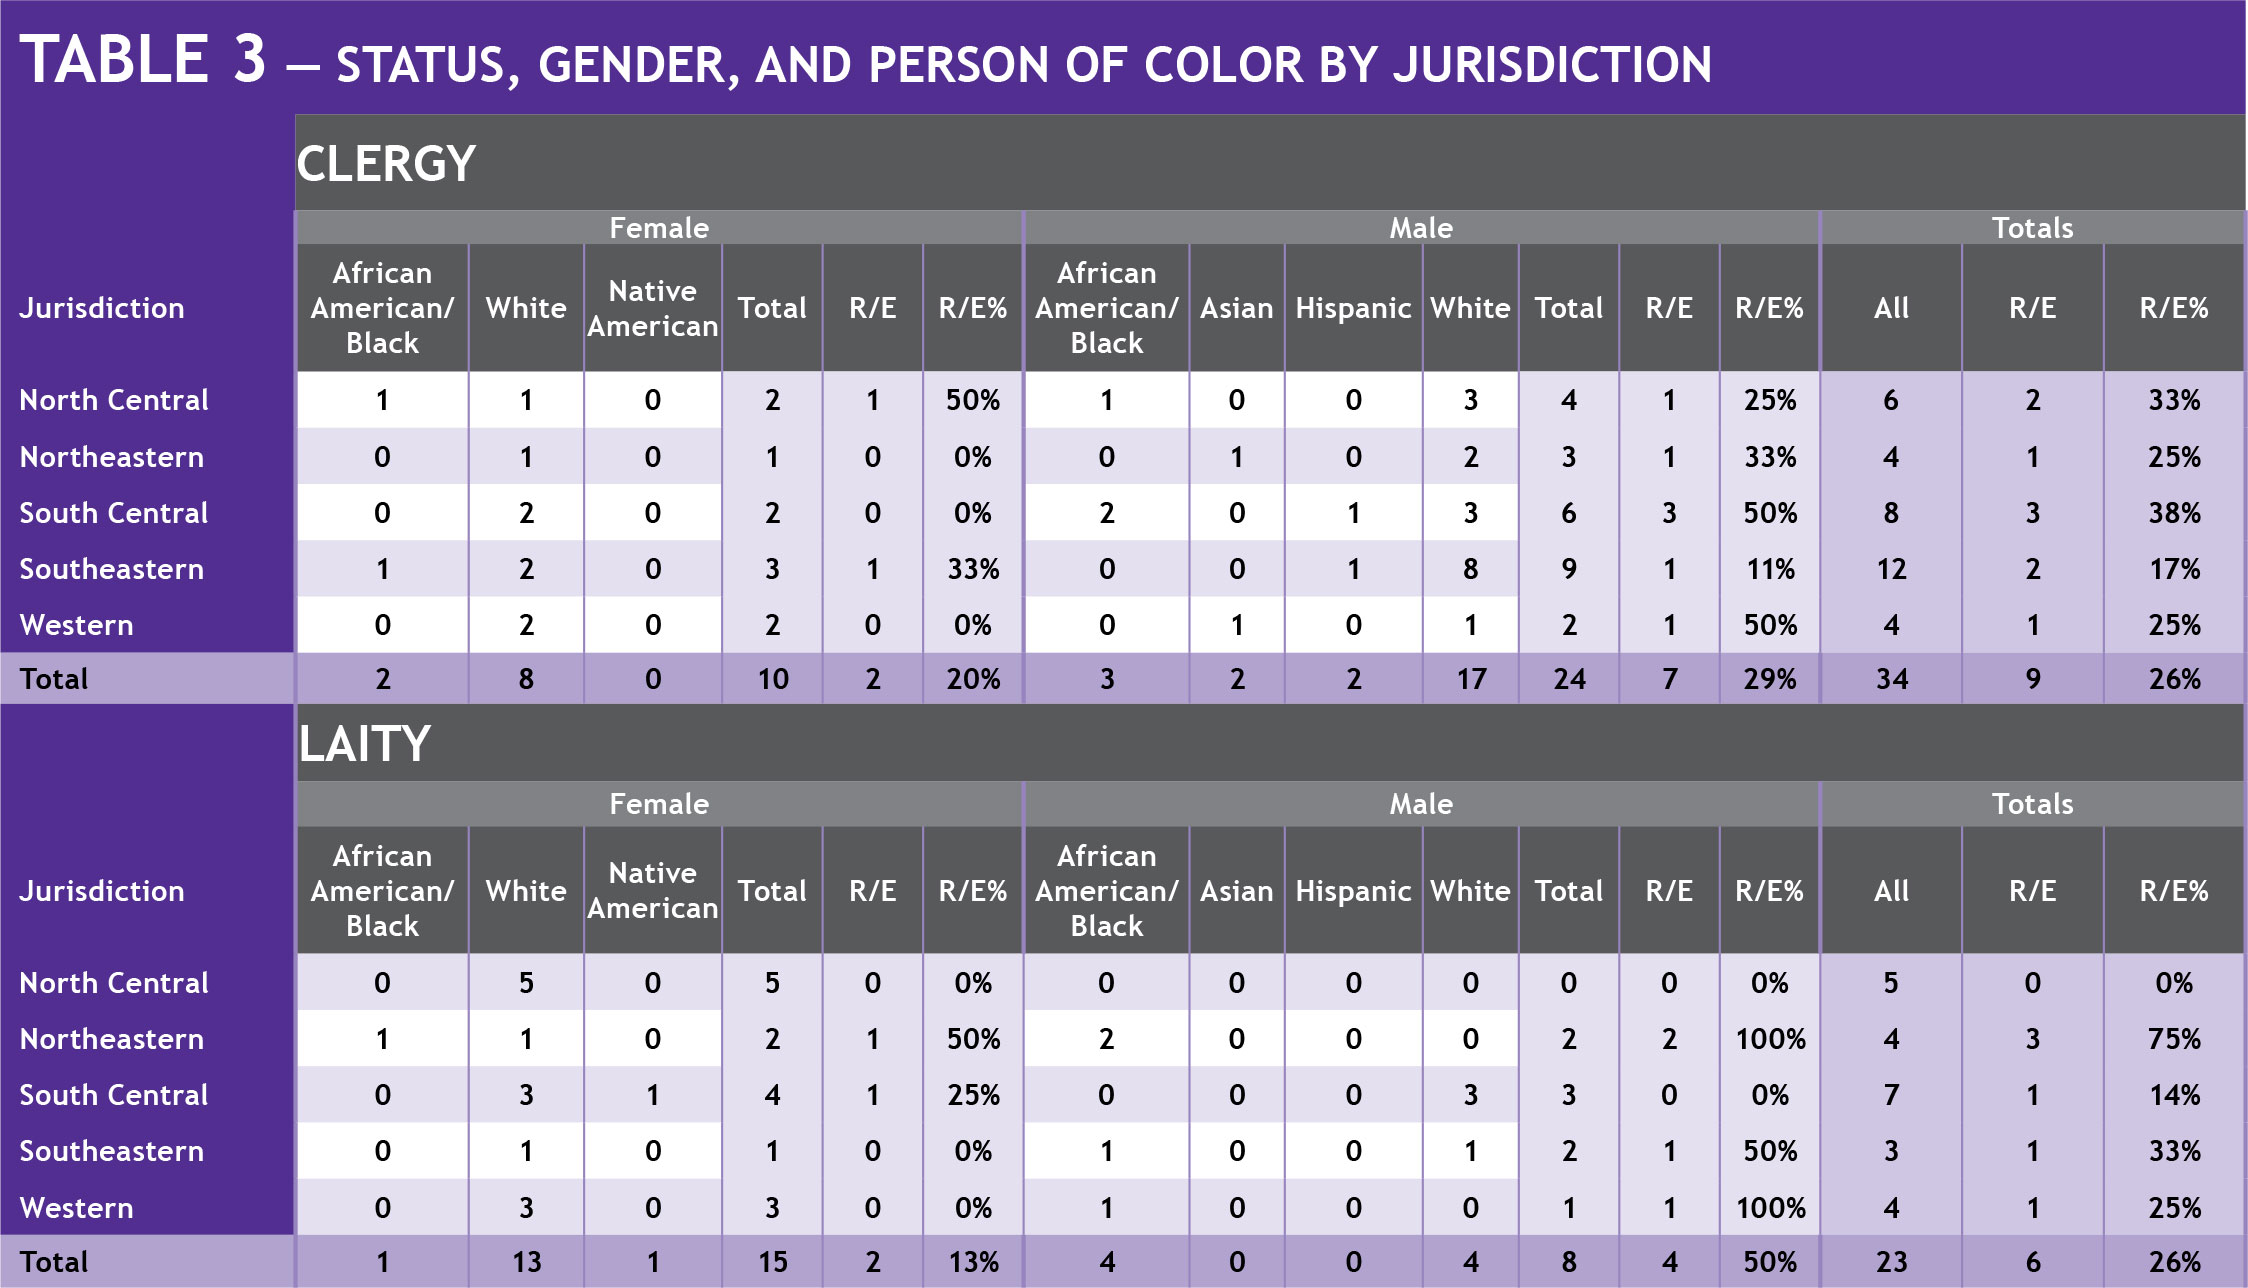
Clergymen (24) and laywomen (15) have the largest representation of the delegation chairs (see Table 3). Clergymen have twice as many chairs as clergywomen (10) and laywomen have almost twice as many chairs as laymen (8). It should also be noted that the number of clergy male chairs (24) is just one less than that of laywomen and clergywomen combined (25).
Race-Ethnicity
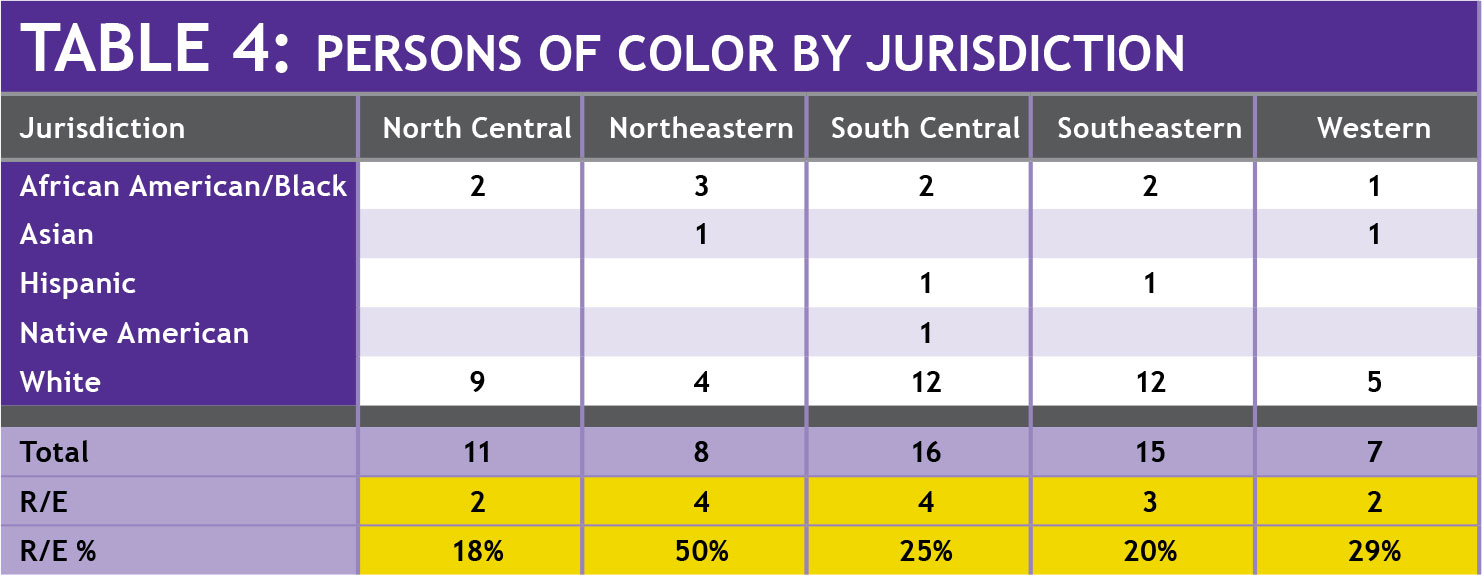
Fifteen (15) of the 57 U.S. chairs are persons of color (see Table 4). The 15 represent 26% of the total number of chairs, which gives persons of color better representation as chairs than as actual delegates, who have 22% overall representation. The Northeastern Jurisdiction has half of its chairs as persons of color. All the other jurisdictions have between 18% (North Central Jurisdiction) to 29% (Western Jurisdiction) persons of color as chairpersons.
There are African-American chairs in each of the five jurisdictions. Other ethnicities are not well represented among the jurisdictions.
Of the 15 persons of color, four are women: two laywomen and two clergywomen. The 11 men are divided into seven clergy and four laity (see Table 3). Women, who are persons of color, represent just 7% of the total chairs of delegations.
Correction
In the February 2012 issue, some of the tables in Women by the Numbers were mislabeled. Please download the corrected version of the tables at www.gcsrw.org.Professional Status
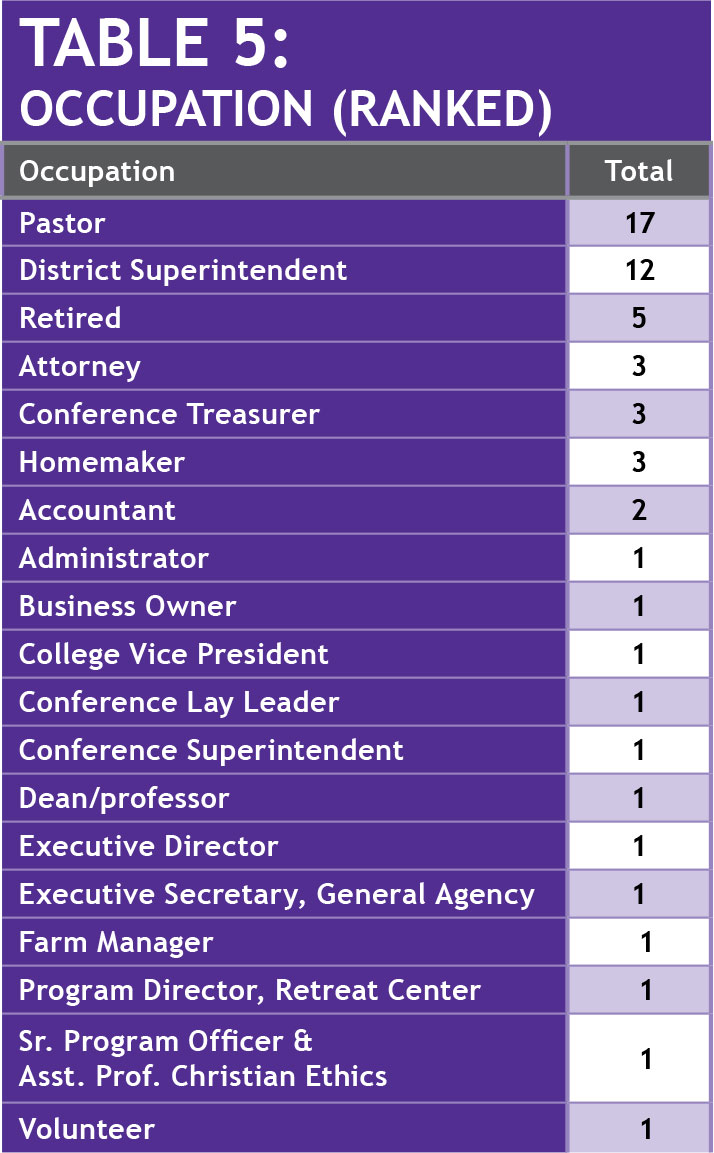
Since clergy have the largest representation of the delegation chairs, it should come as no surprise that the top two occupations are pastor and district superintendent. “Retired” is the third largest occupation and it reflects the overall make-up of laity who attend General Conference who need two weeks to dedicate to the work of the church.
Legislative Committee
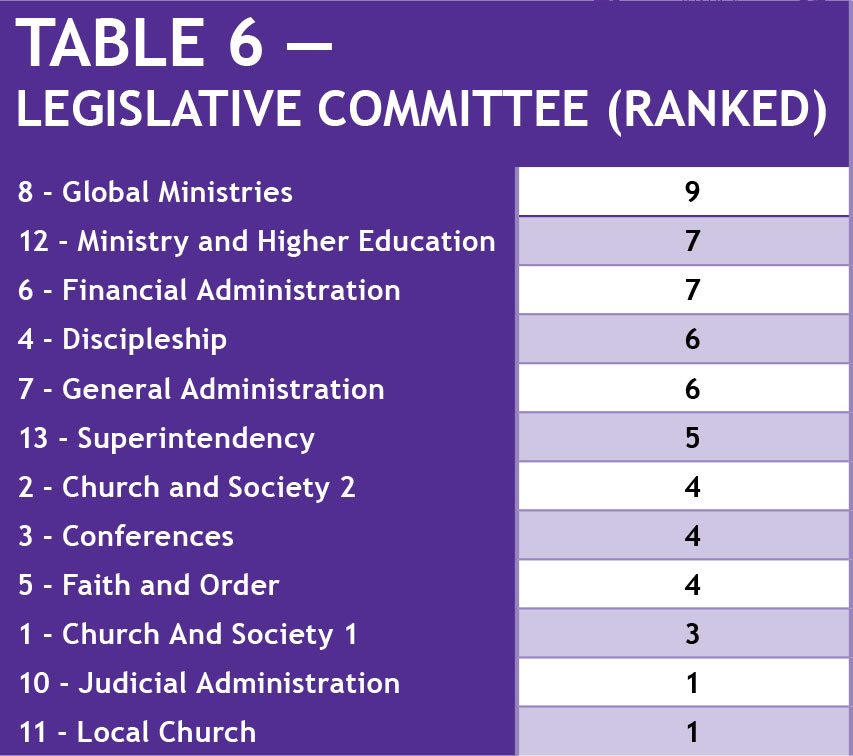
Being elected chairperson of a delegation does bring with it the pressures of leadership and administration. However, one of the benefits of being elected chair is usually the ability to have the first choice of legislative committee assignment. The Global Ministries Legislative Committee is the most popular for chairpersons, with nine chairs. Ministry and Higher Education and Financial Administration are next popular, with seven chairs each. All the legislative committees have at least one delegation chair with the exception of one: independent commissions.
Conclusion
Chairing an annual conference delegation comes with considerable responsibility and, frankly, considerable prestige and influence. Clergy chairpersons are often endorsed as episcopal candidates and, subsequently, are elected as bishops. That prestige and responsibility is still largely in the hands of men and white U.S. people, so it begs the question, “Is The United Methodist Church preparing and elevating leaders to relate to the people of God now and into the future?”
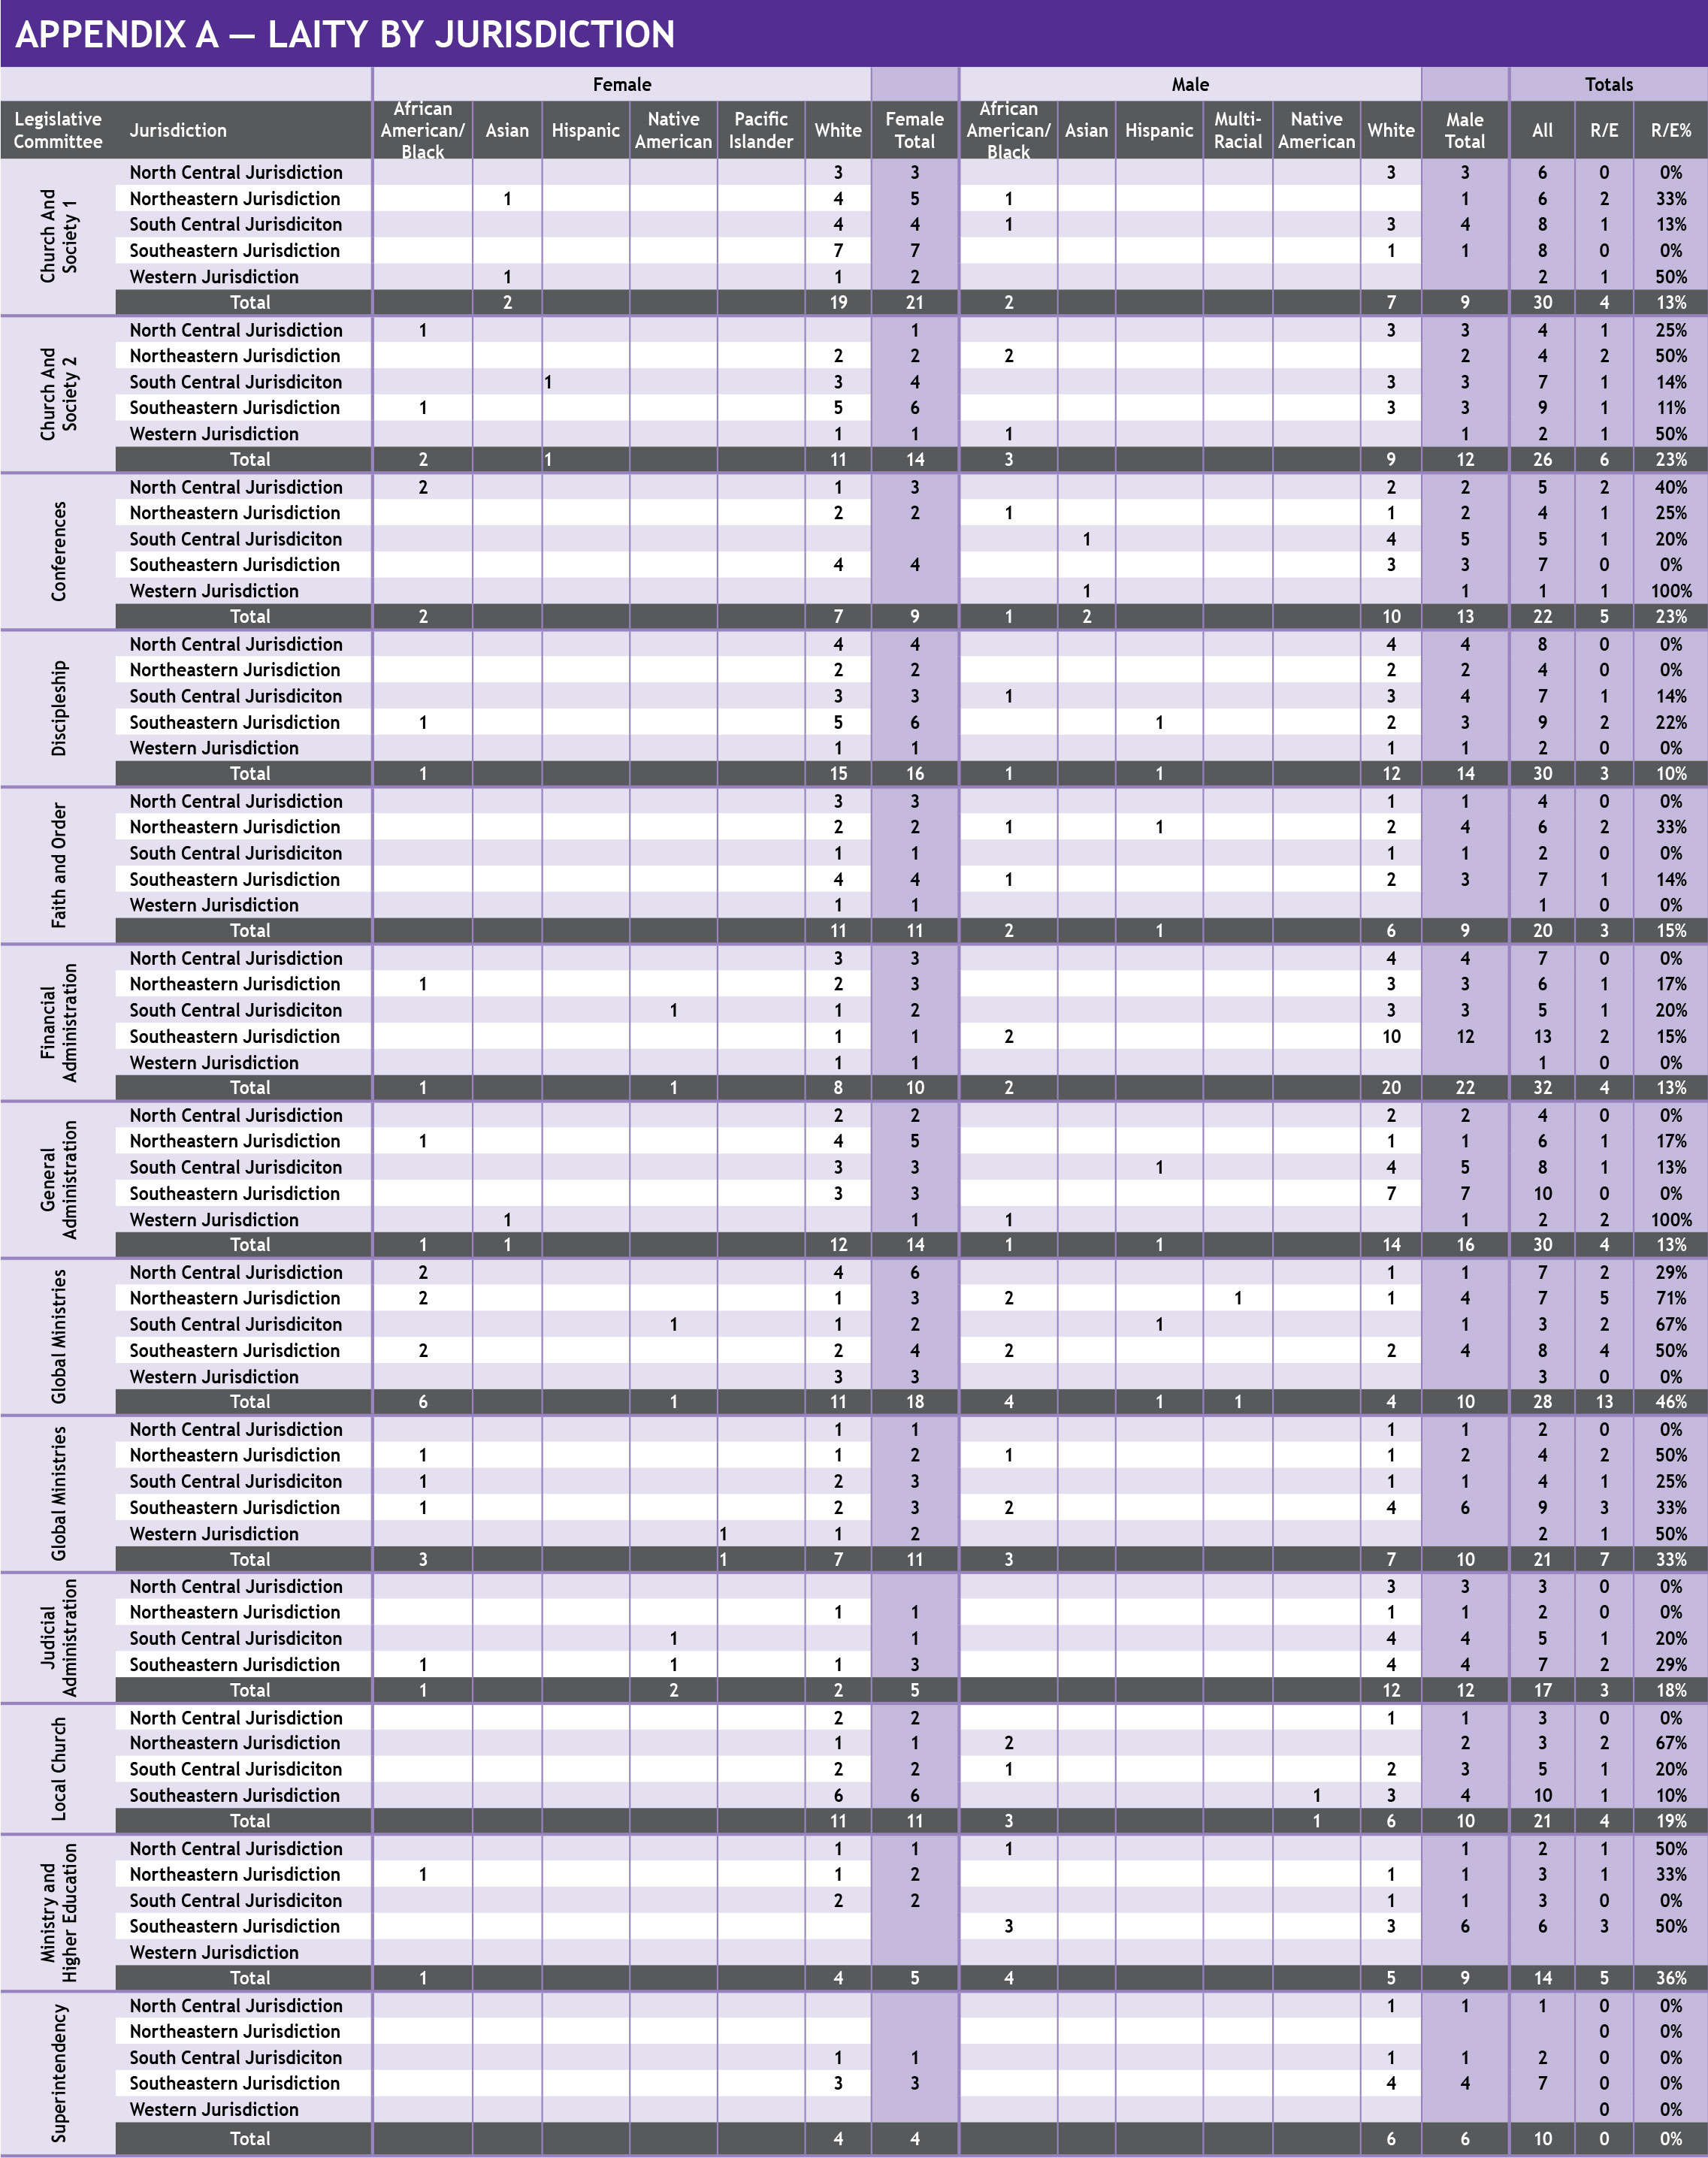
Who are on which General Conference legislative committees?
Each of the nearly 1,000 delegates elected by annual conferences to General Conference is assigned to one of 13 legislative committees. These committees review and make recommendations on the more than 1,600 petitions submitted from across The United Methodist Church for consideration by the lawmaking assembly.
(General Conference 2012 will be held April 25-May 5 in Tampa, Fla.)
While it may not be possible to predict how delegates as a body will act on a particular piece of legislation, the demographics of the General Conference as a whole—as well as the demographics of each legislative committee—offer some insight into the perspectives that are (or are not) represented at the high decisionmaking tables of our denomination
General Conference requires that half of all delegates be laity, the other half clergy. This is not the case with legislative committees.
Order of election
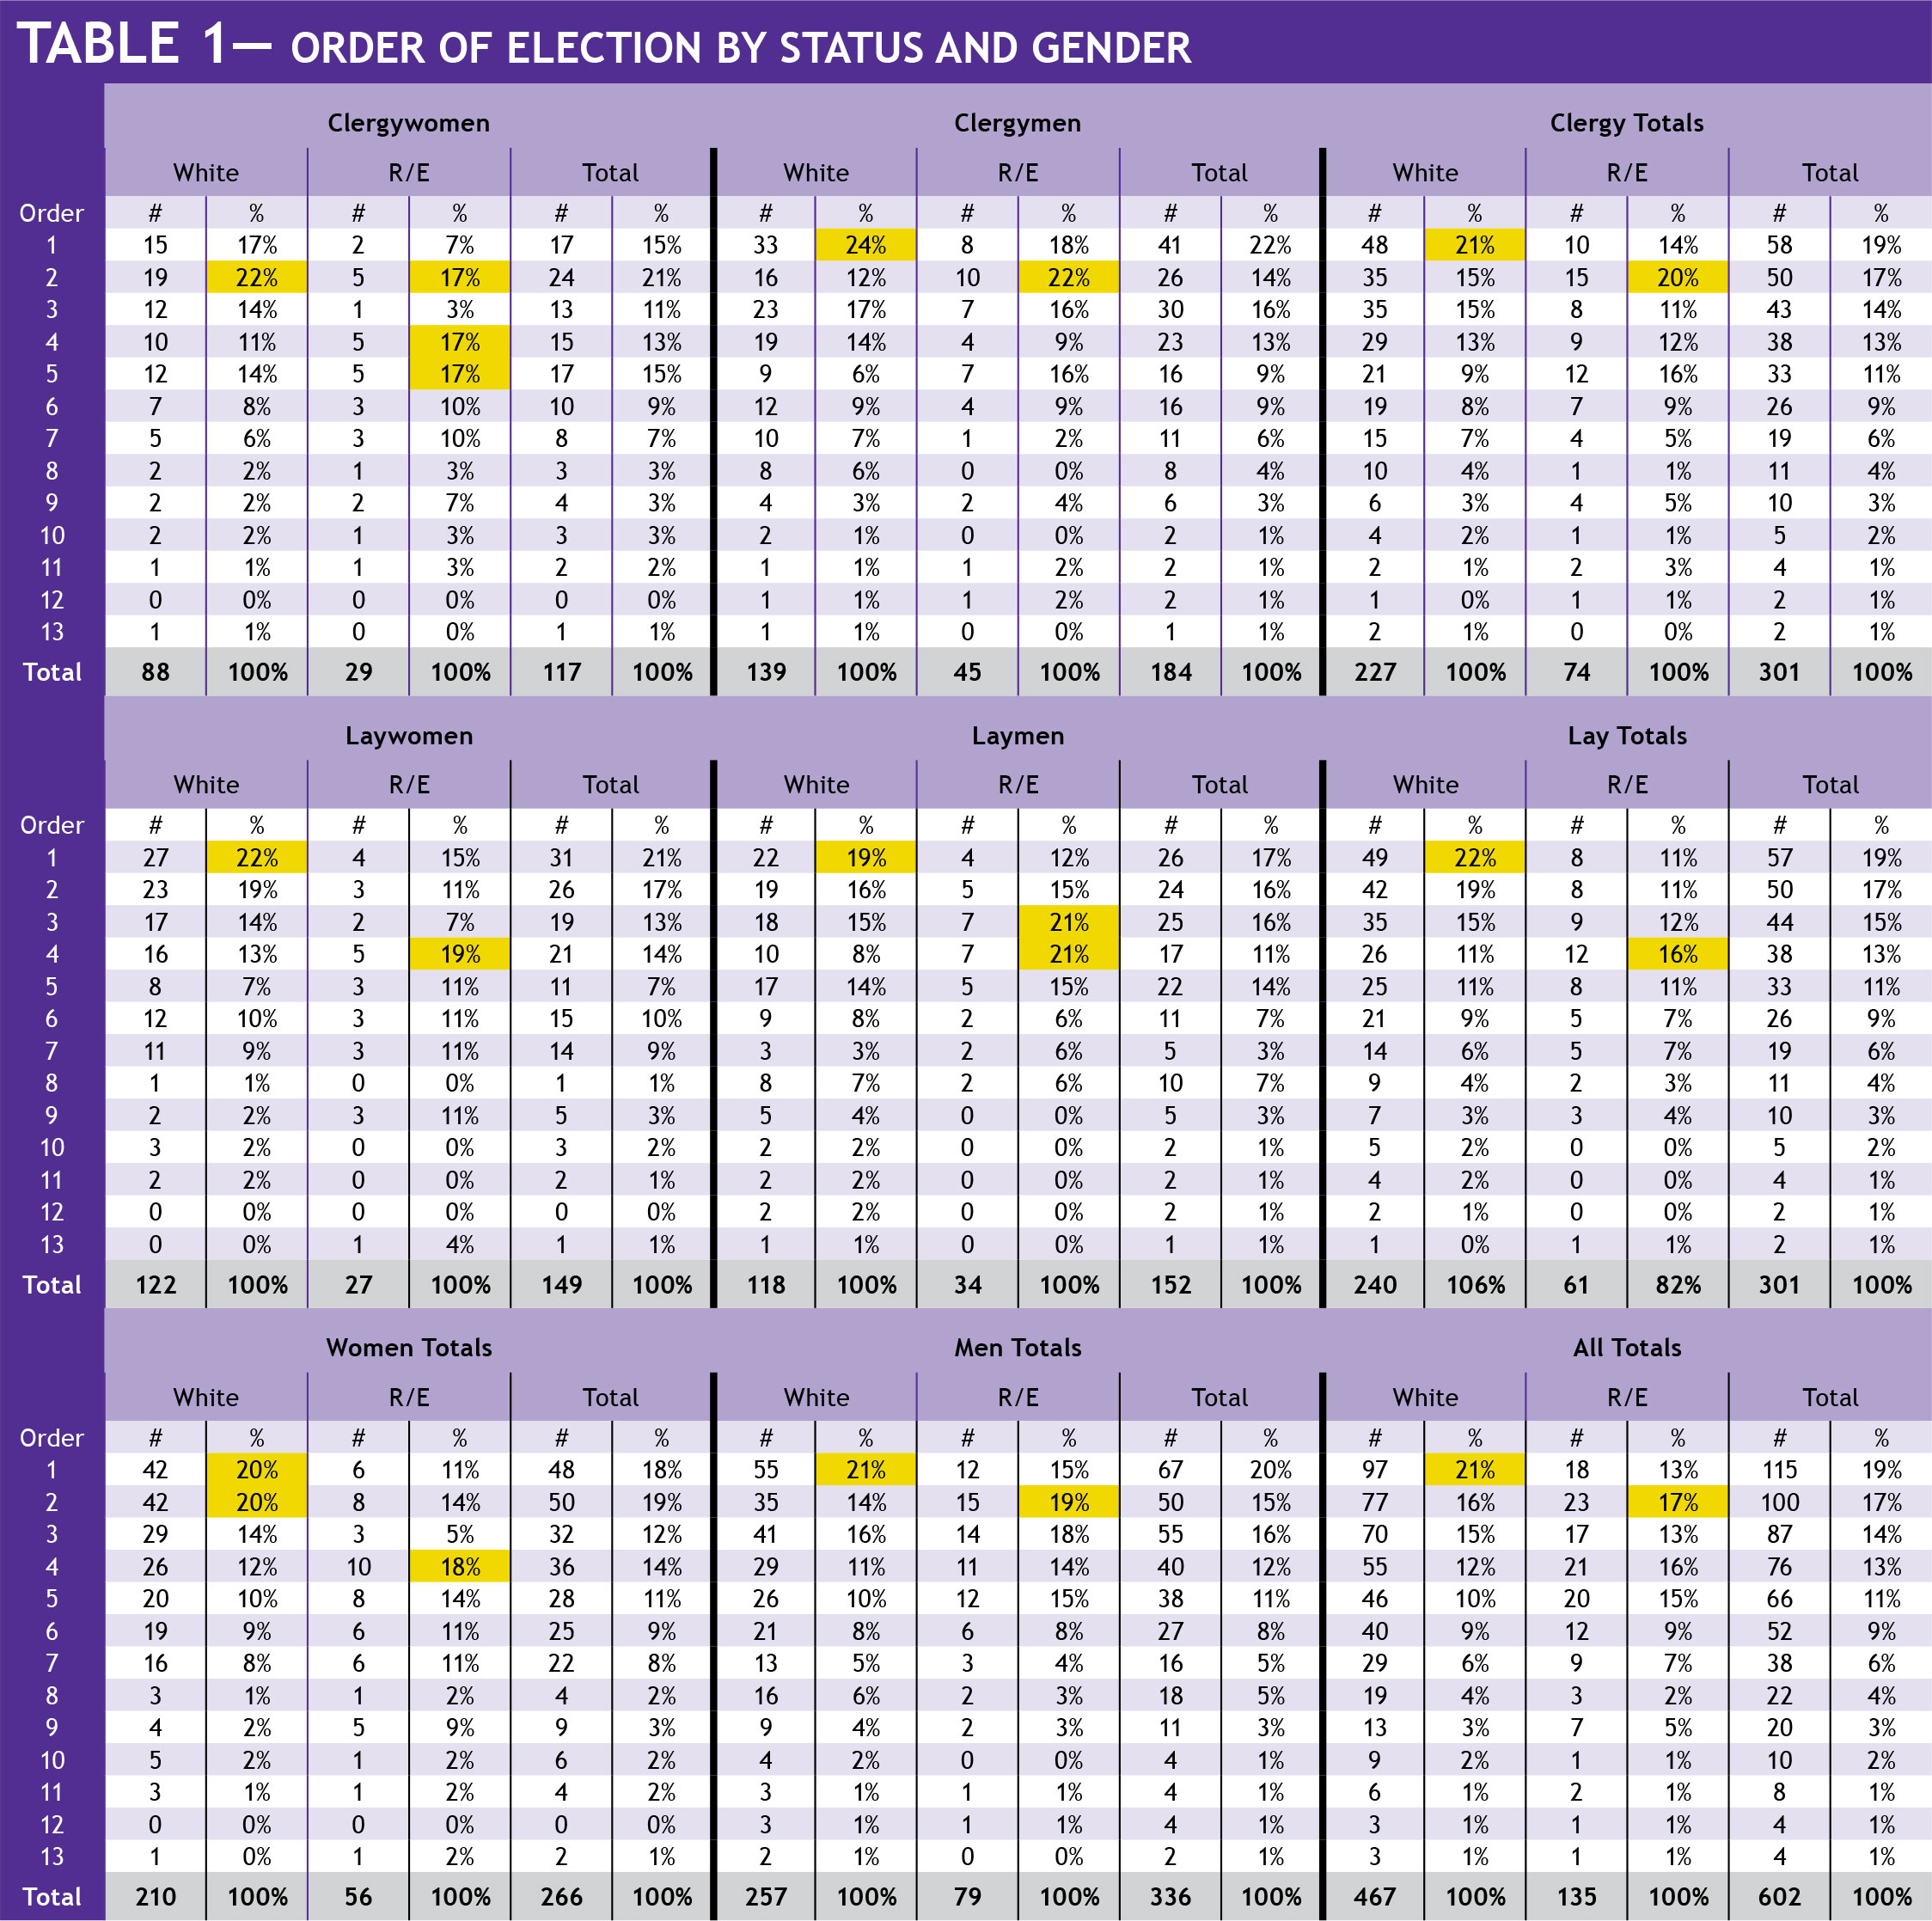
The very order in which delegates are elected in their respective annual conferences can influence the make-up of legislative committees. Individuals elected first in their annual conferences get first choice of legislative assignments; the person elected second gets second choice and so on. The number of delegates allotted to each annual conference is determined by total church membership in that respective area, with a minimum of two—one layperson and one clergyperson—for the smallest conferences.
This means that annual conferences with larger delegations may have representatives in all 13 committees, and may be able to have multiple delegates in a particular committee to wield considerable influence on voting. Conversely, annual conferences with smaller delegates do not have the opportunity to influence discussion and voting in every legislative committee.
Among U.S. annual conferences, more than one-third (37%), of all white delegates are elected first and second among their delegations, while less than a third (30%) of persons of color are elected first and second (see Table 1). An argument could be made that smaller delegations with just two delegates bias the results so that more white people are elected first and second; however, several smaller annual conferences in fact elect persons of colors to the first and second positions. Size does not matter—commitment to inclusivity does.
White clergymen are more likely than white clergywomen or clergypersons and laity of color to be elected in the first or second position (see Table 1). Most noticeable is the election of laypersons where white laymen and laywomen have their largest percentage of individuals elected first in their delegations.
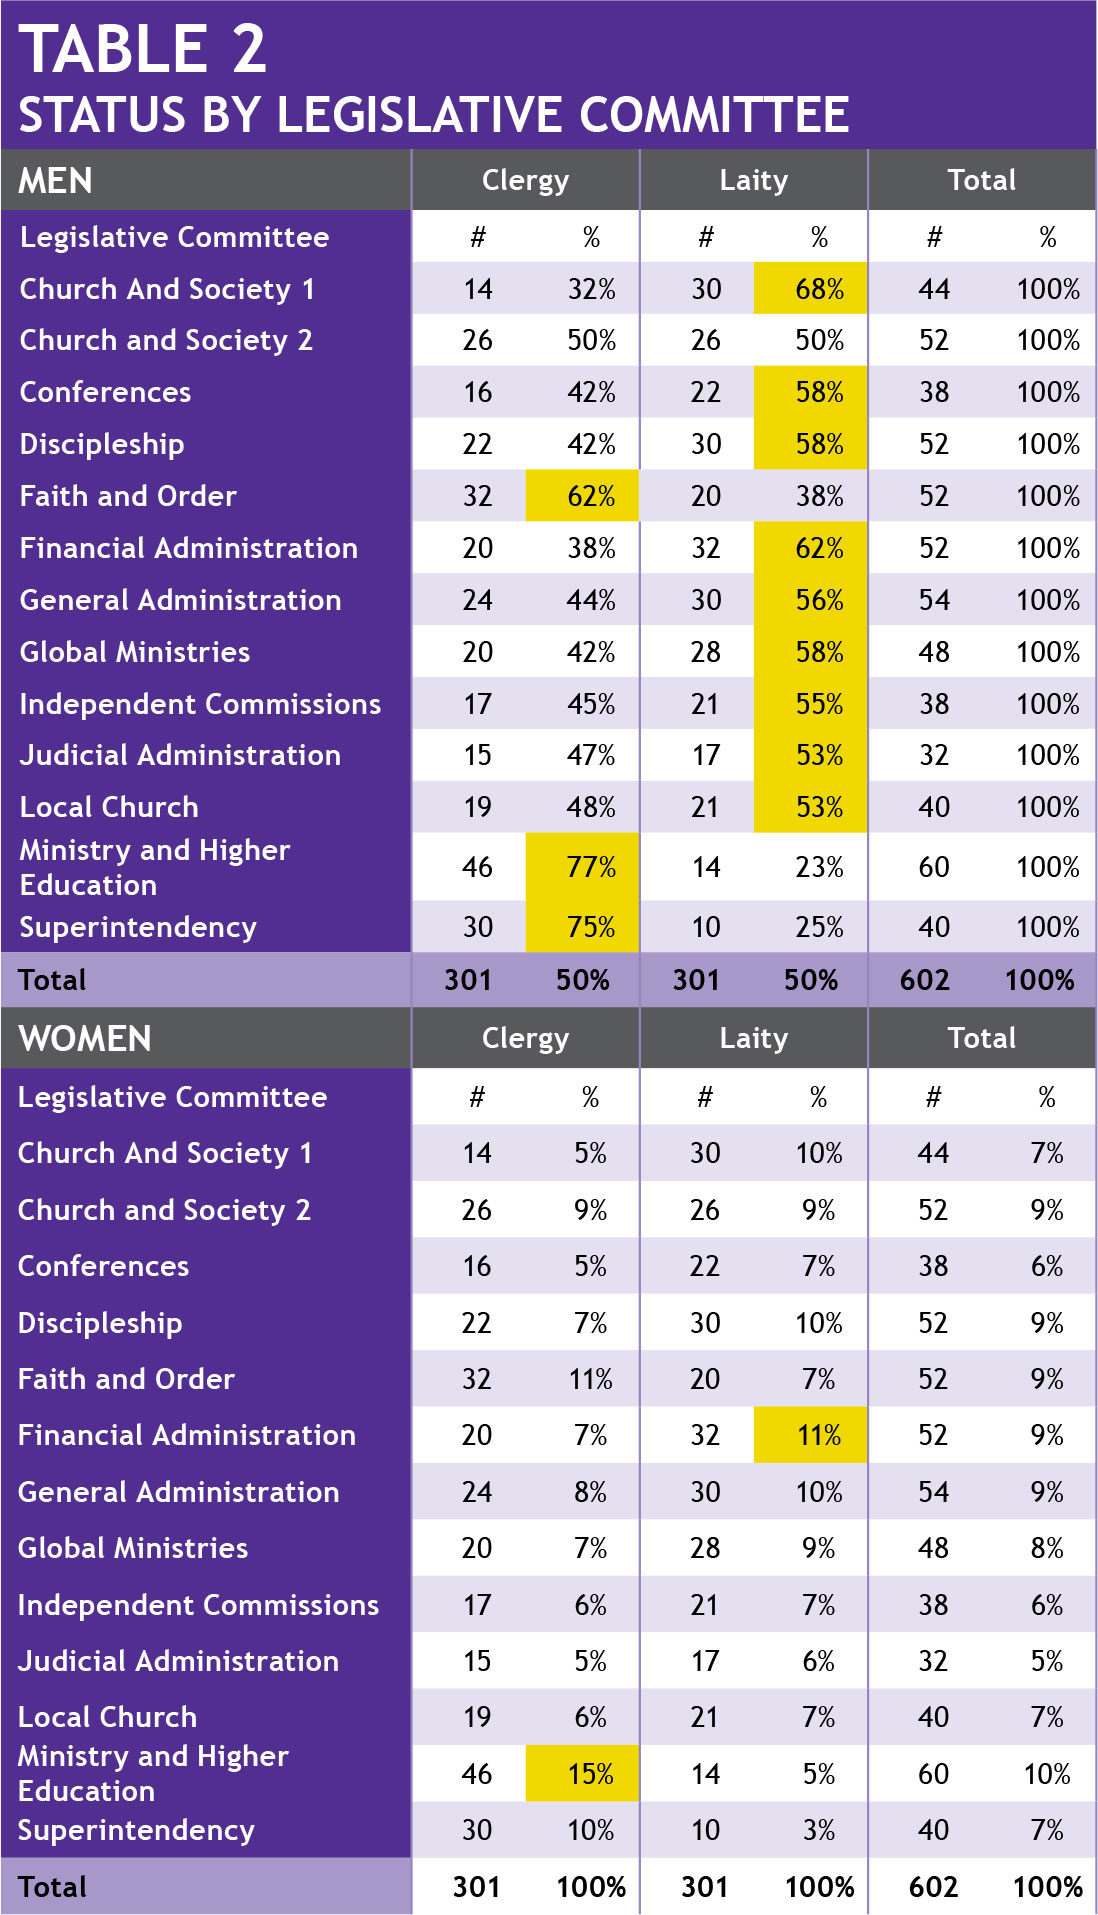
Clergy-lay status
General Conference requires that half of all delegates be laity, the other half clergy. This is not the case with legislative committees, however. In fact, among U.S. delegates, clergypersons comprise the majority of members in three committees: Faith and Order, Ministry and Higher Education, and Superintendency (see Table 2). More than one-third (37%) of all U.S. clergy delegates are concentrated in those three committees. The largest percentage of lay delegates are represented in the Financial Administration committee (11%), followed by Church and Society #1 (10%), Discipleship (10%) and General Administration (10%).
Gender
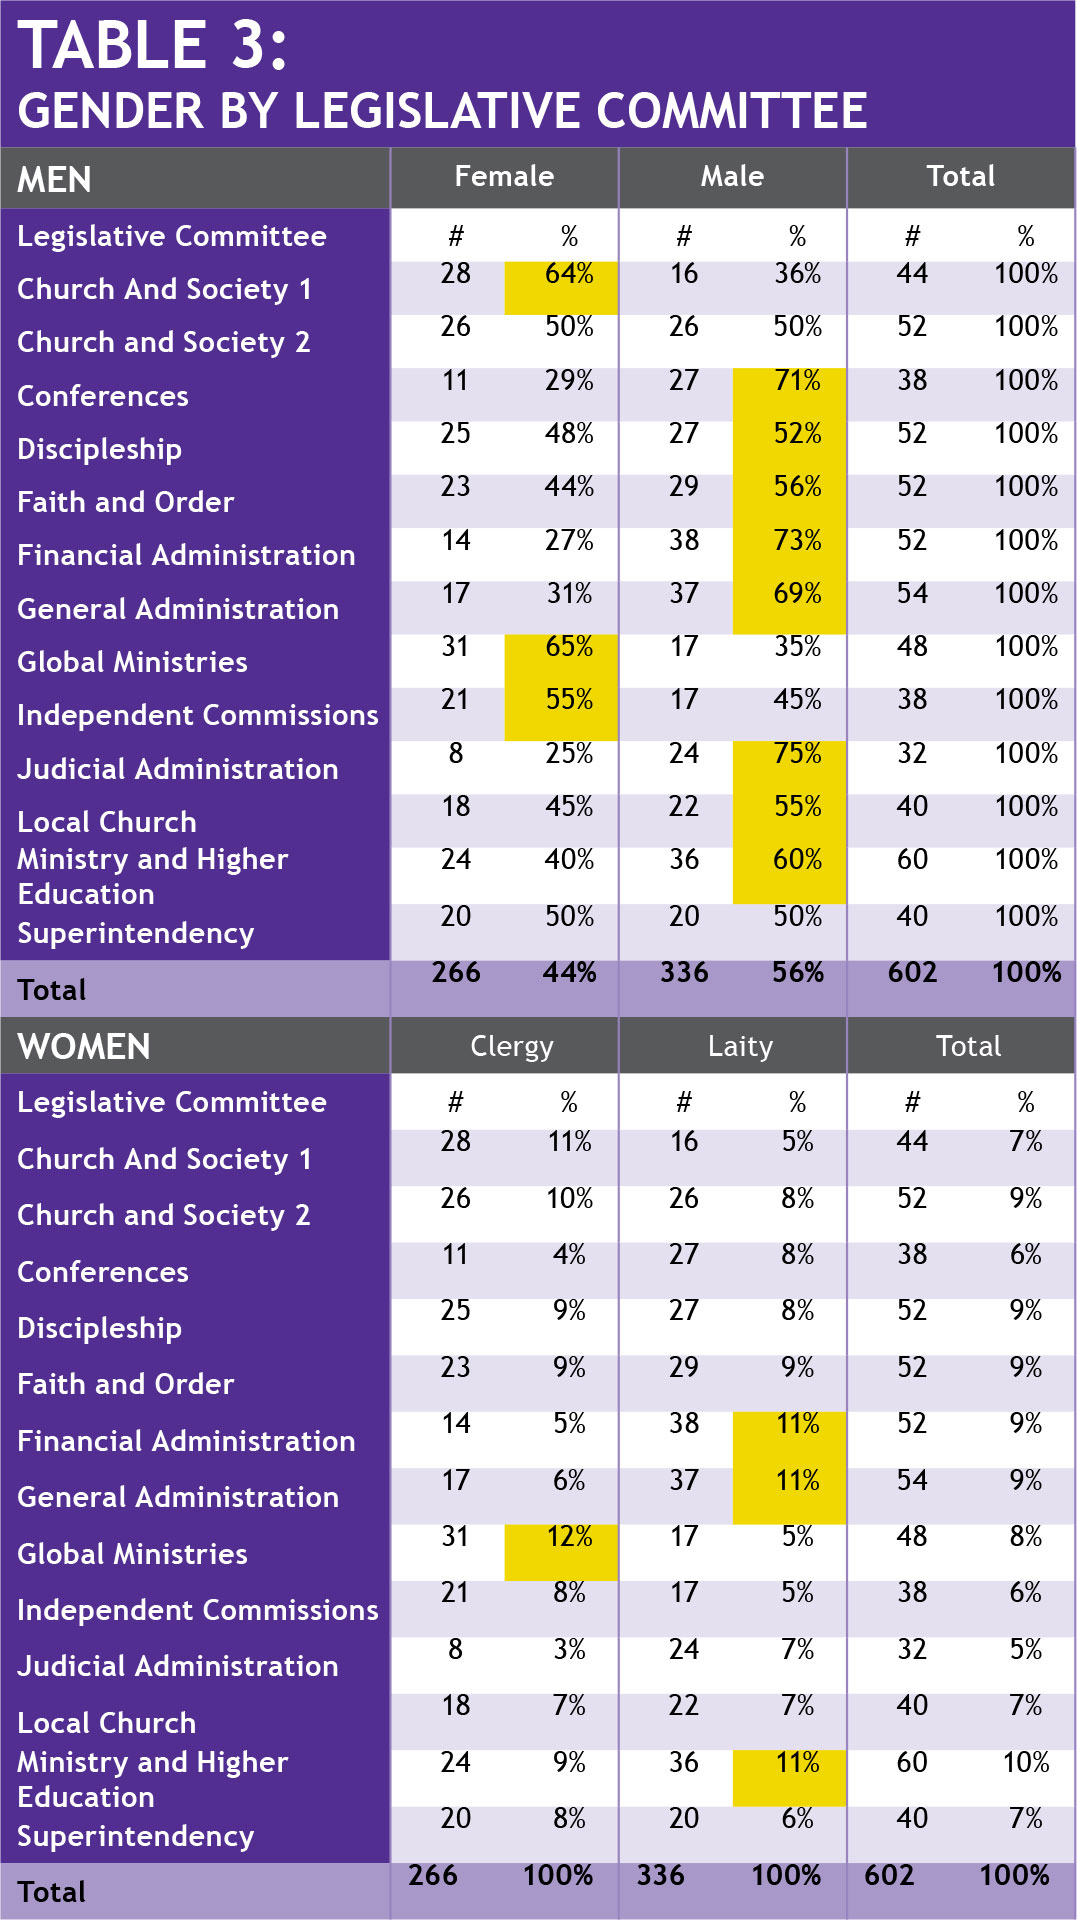
Men outnumber women at General Conference (56% to 44%), so it is no surprise that men hold a majority of seats in eight out of the total 13 committees (see Table 3). Women hold a majority of seats in three legislative committees—Church and Society 1, Global Ministries and Independent Commissions. The other two committees, men and women have an even split – Church and Society 2 and Superintendency.
Men have their largest numbers on three committees—financial administration (38), general administration (37), and higher education and ministry (36). Women have their largest representation on global ministries (31), in part because legislation regarding United Methodist Women is assigned to that committee.
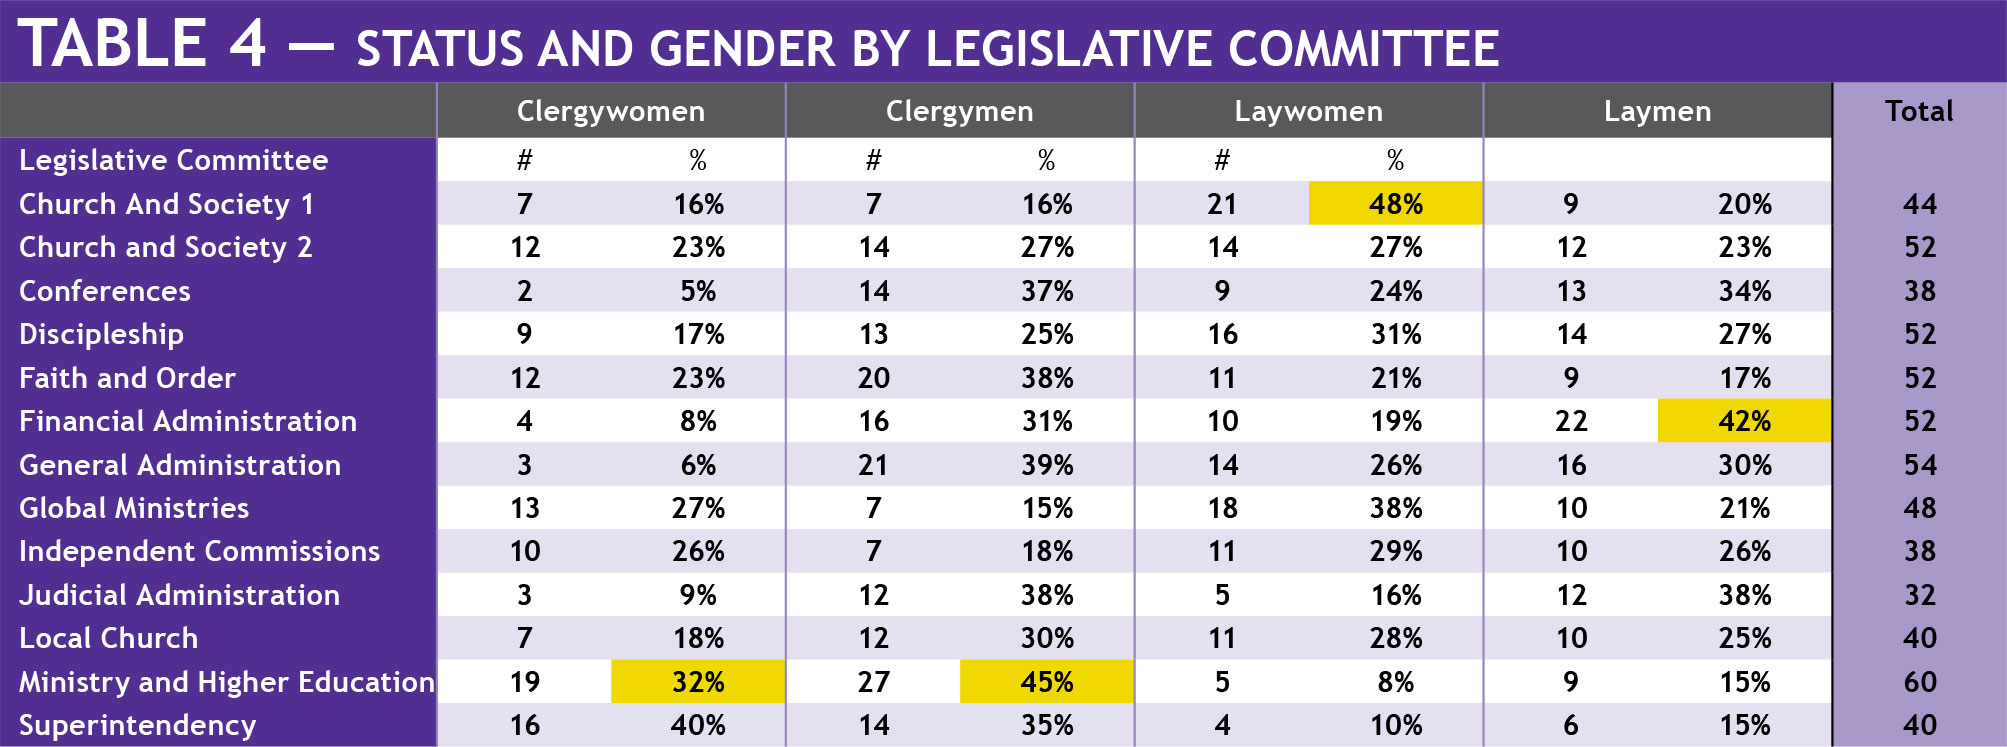
Clergymen and clergywomen have the highest representation in the Higher Education and Ministry committee (Table 4). Laymen have their highest concentration in Financial Administration and laywomen in Church and Society.
Racial/ethnic distribution
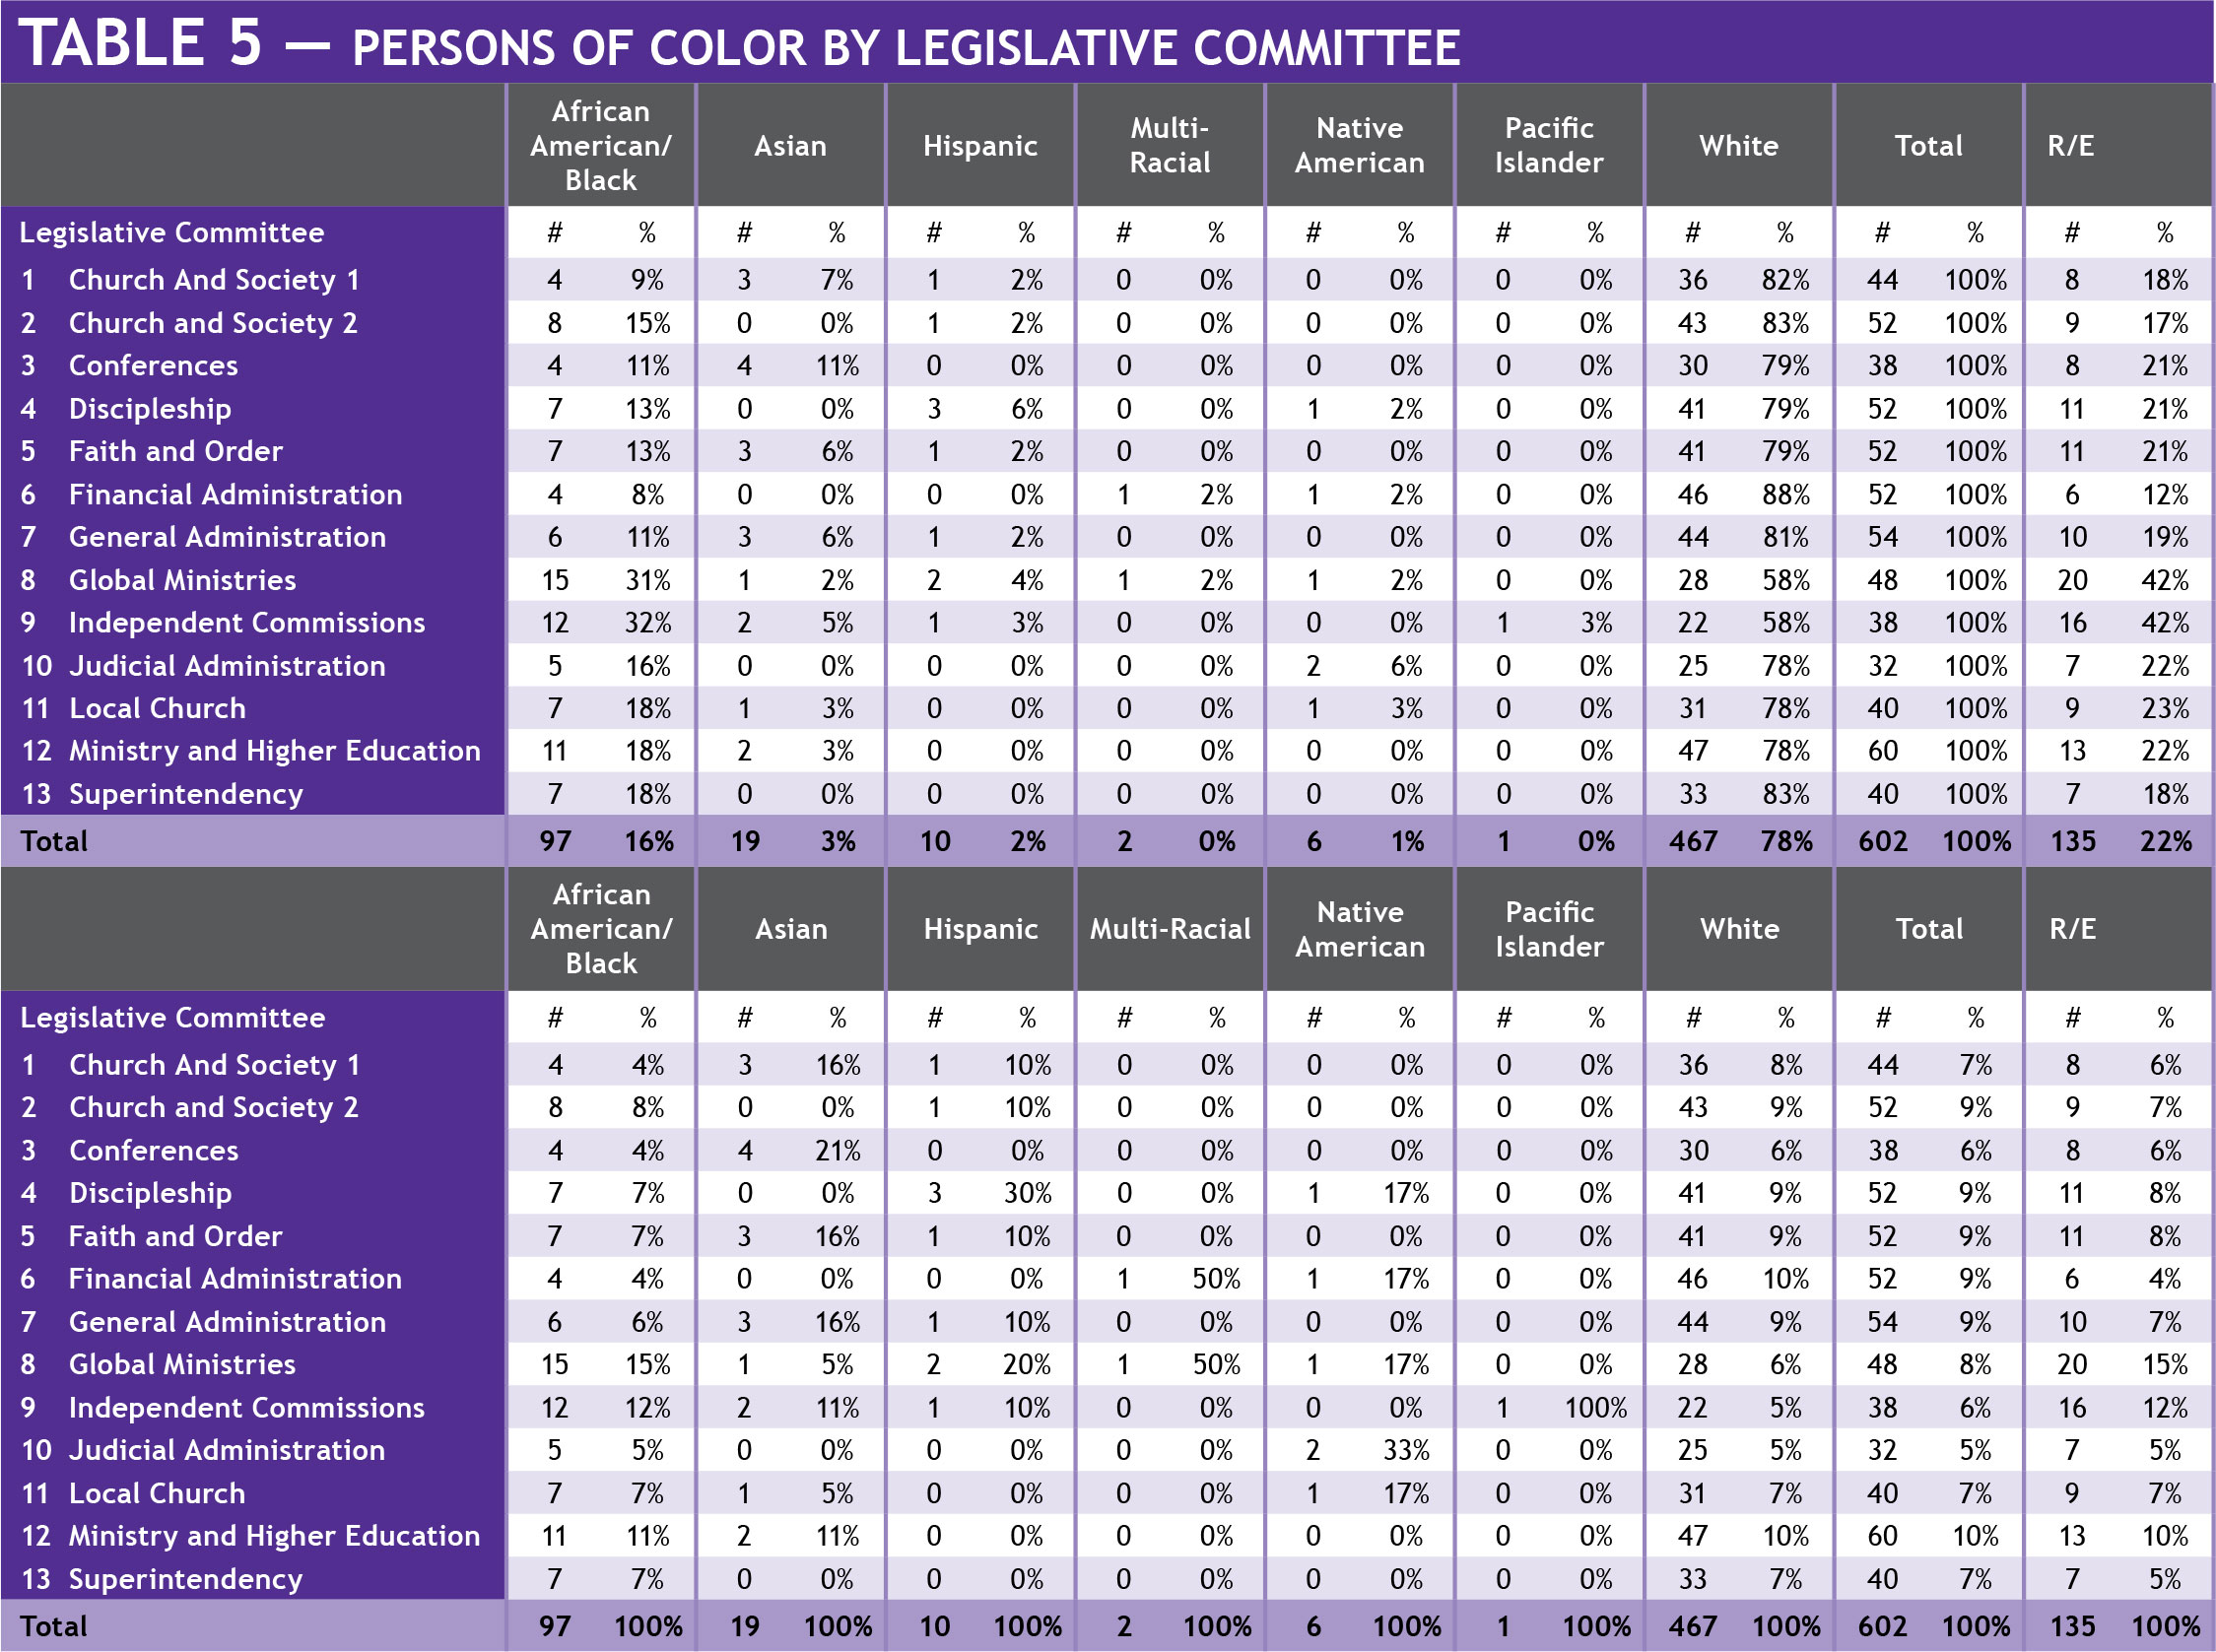
U.S. delegates of color have their largest representation in two legislative committees—Global Ministries and Independent Commissions (see Table 5). Of the 135 U.S. persons of color who will be delegates at the 2012 General Conference, 36 (or 27%) are assigned to these two committees. As noted in a previous article (January 2012), with only 135 delegates and 13 committees, representation and voice for U.S. persons of color are limited on average to 10 persons per committee.
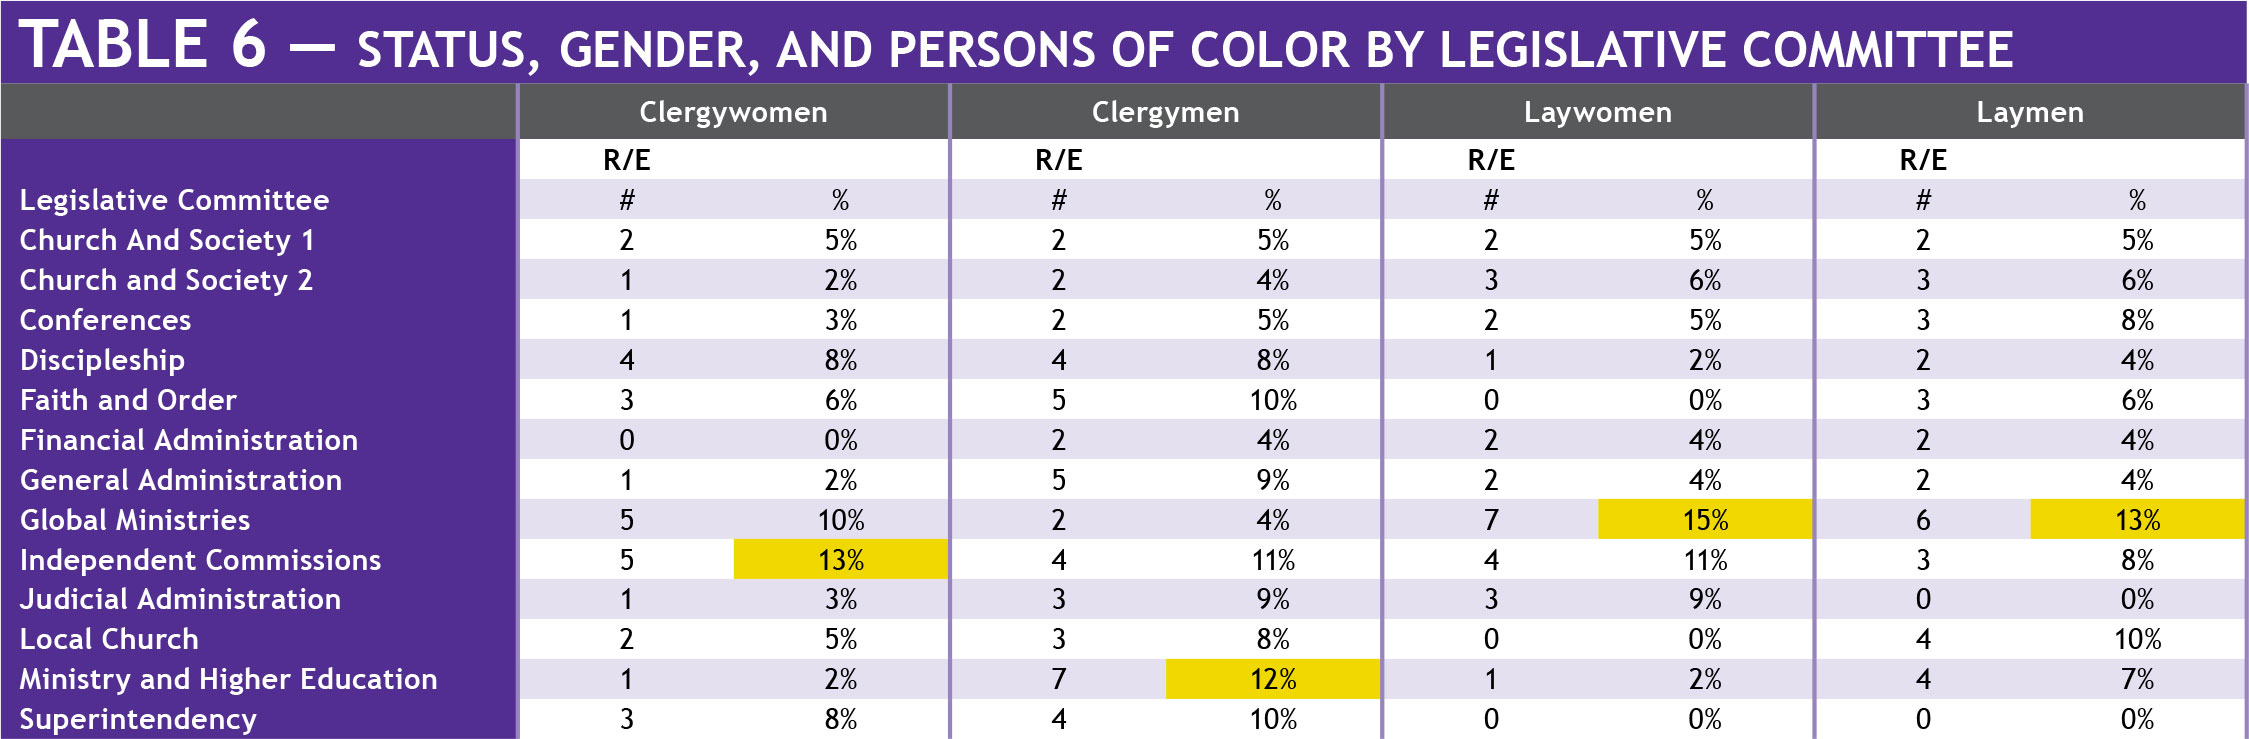
Clergymen of color have their largest concentration (12%) in Higher Education and Ministry while clergywomen of color have their largest concentration (13%) in Independent Commissions (Table 6). Both laywomen (15%) and laymen (13%) of color have their largest concentrations in Global Ministries.
By jurisdiction
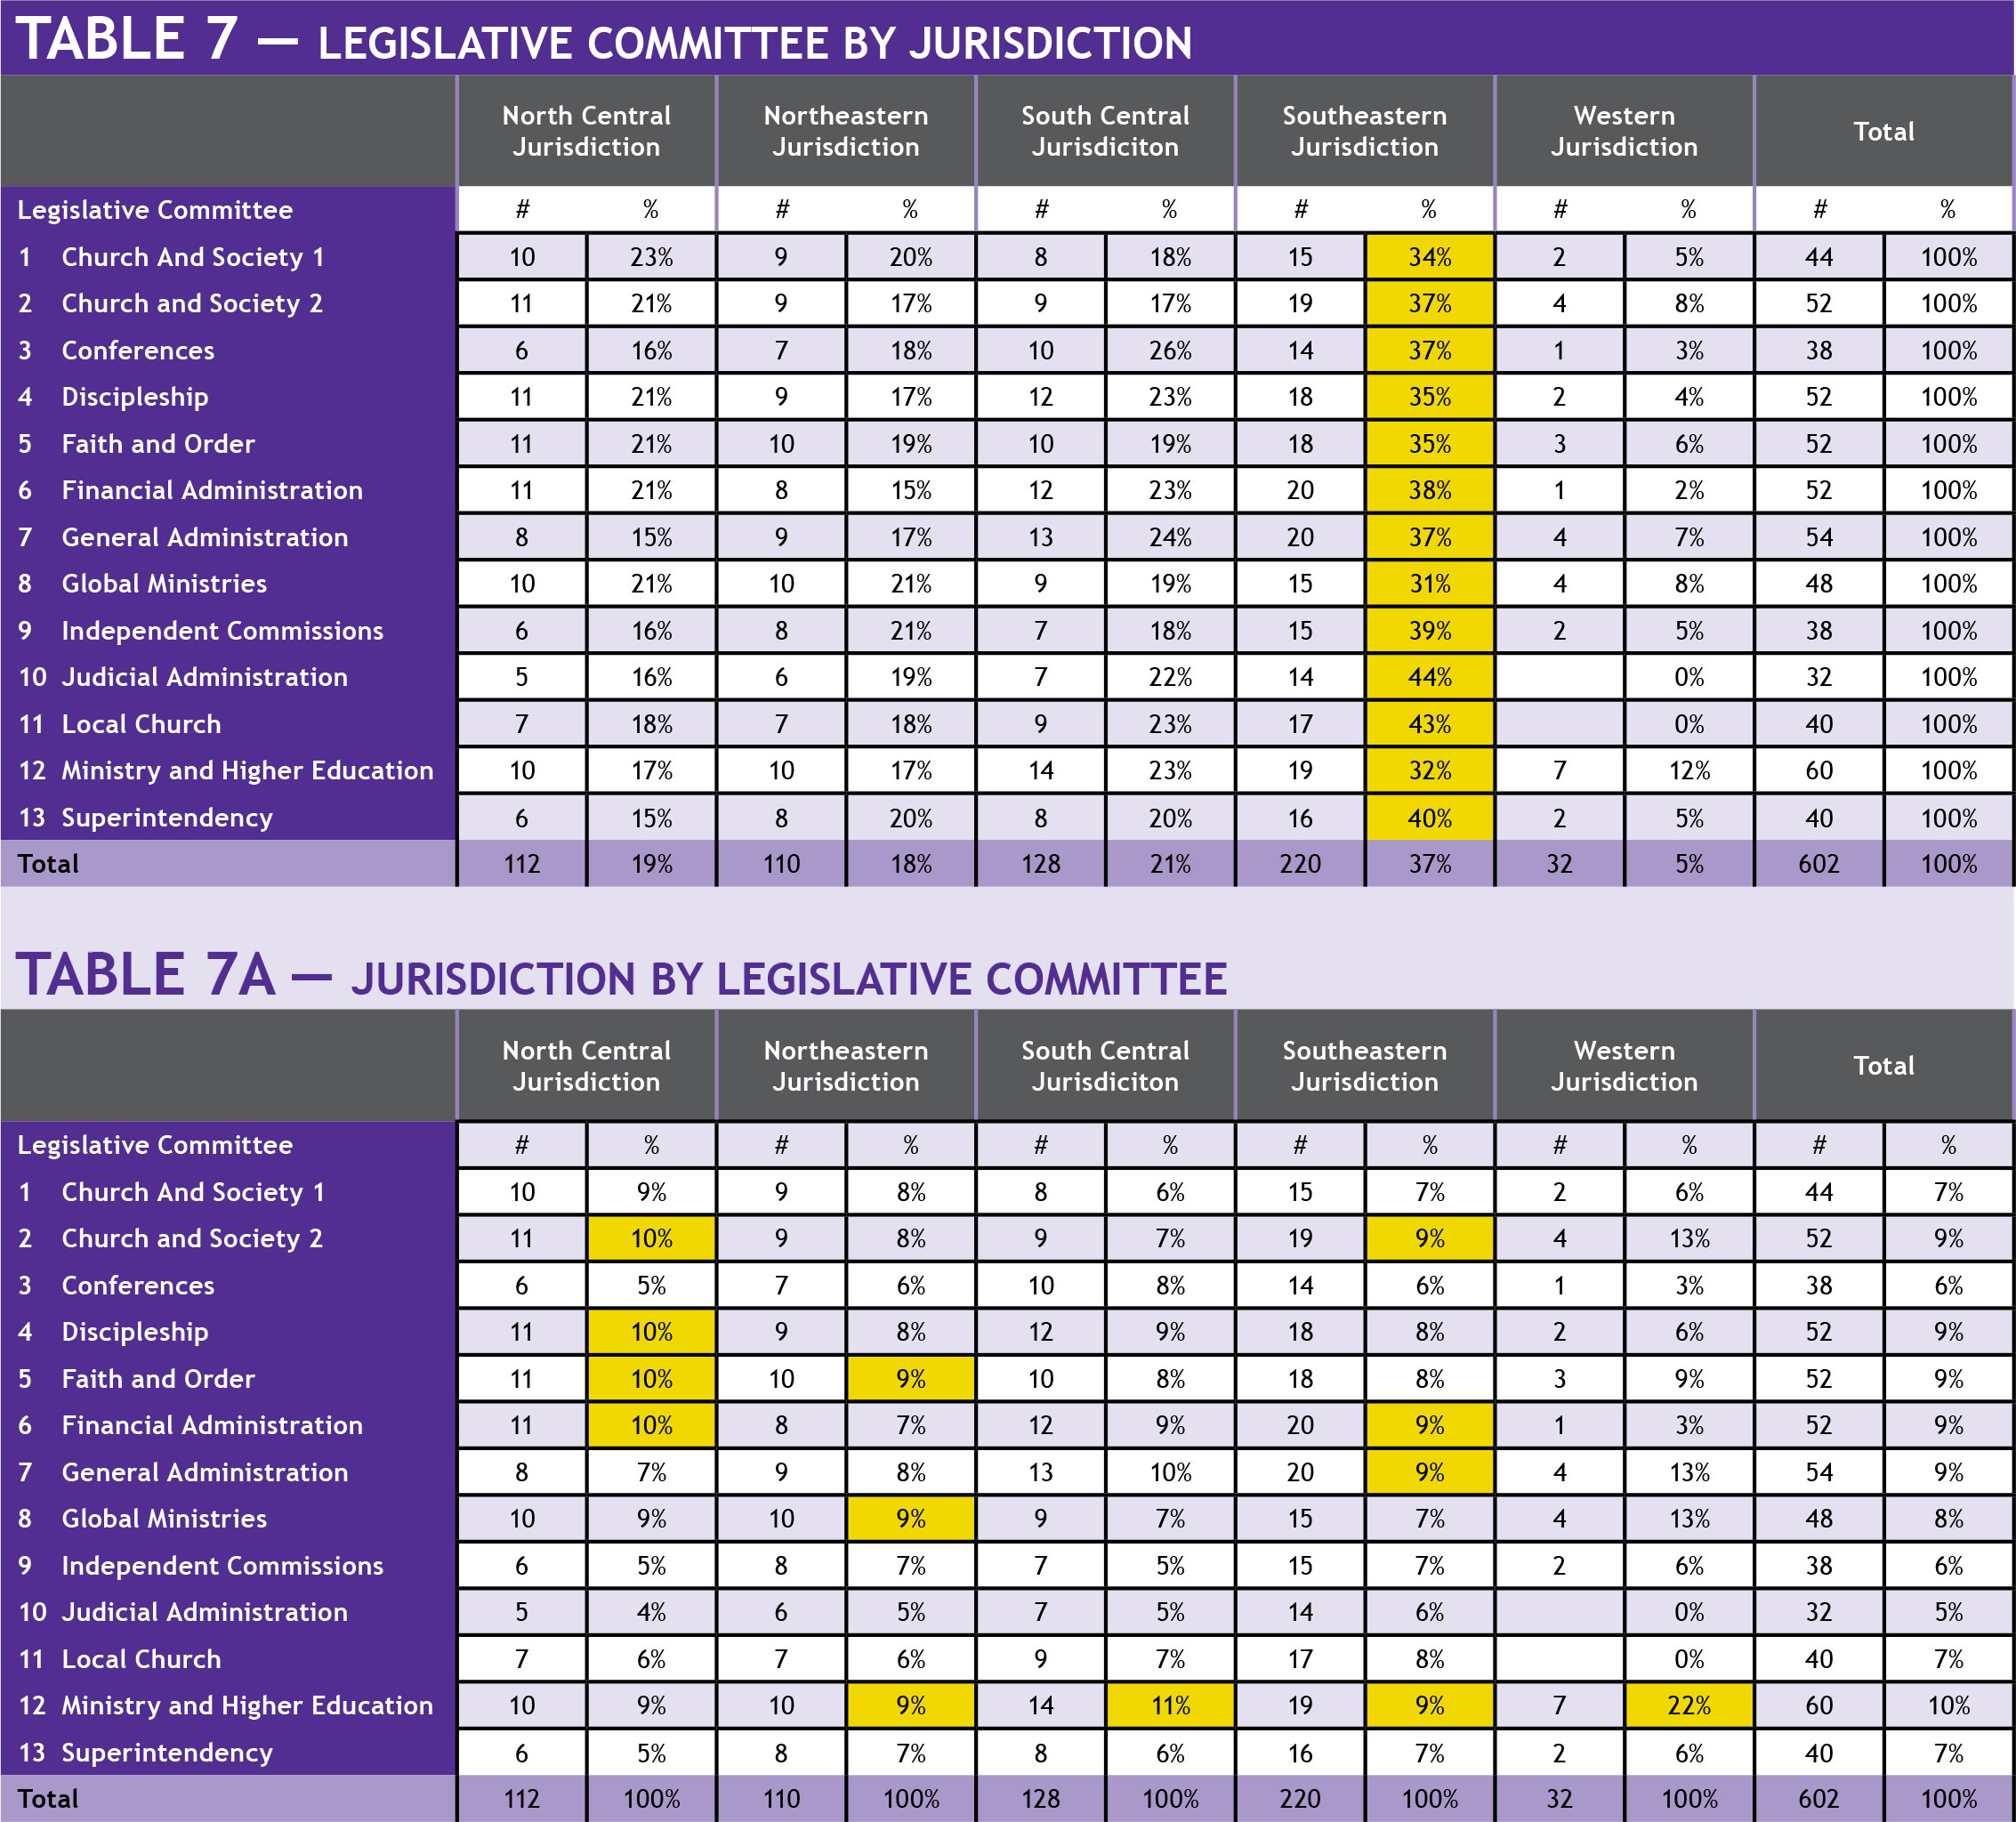
Since the Southeastern Jurisdiction has the most delegates, it has the most representation on each of the 13 legislative committees. Its lowest representation is 31% on Global Ministries and its highest is 44% on Judicial Administration.
By legislation
The Western (22%) and South Central (11%) jurisdictions have the largest percentage of their delegates on the Higher Education and Ministry committee. The Northeastern Jurisdiction’s delegates are most represented (9%) among three legislative committees: Faith and Order, Global Ministries and Higher Education and Ministry.
The Southeastern Jurisdiction’s delegates split it highest concentration (9% each) four ways among Church and Society 2, Financial Administration, General Administration, and Higher Education and Ministry. The North Central Jurisdiction also splits its highest concentration of delegates (10%each) four ways among Church and Society 2, Faith and Order, Discipleship, and Financial Administration.
Conclusion
By looking at who is in each of the legislative committees, we are also seeing who is NOT part of the legislative committees. As the committees work to review and make recommendations to the life of The United Methodist Church, we can see that the legislative committees will not have the benefit of hearing voices from many segments of the U.S. population. We need to remind ourselves during the conversations and deliberations that we don’t have all the information we need when making decisions. We need to be intentional in seeking out information from people who are not in the room.